ASIA MANUFACTURING COST DRIVER REPORT, 2018 Q2

ASIA MANUFACTURING COST DRIVER REPORT, 2018 Q2
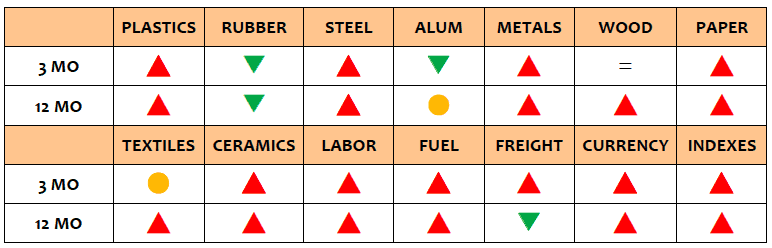
The ASIA MANUFACTURING COST of commodity price trends in the second quarter are mostly up across the board with a few rare exceptions. Most grades of plastics, industrial metals, paper, ceramic and glass raw materials all rose in price while only some grades of rubber and alumina for ceramic production were going down in price. Wood prices meanwhile remained mostly flat and Textiles prices were mixed. Petroleum and fuel prices were up in this quarter and labor rates inched up in the lower wage countries. The US Dollar rose a little bit against most of the Asian currencies in Q2. China exports saw up in the quarter while China imports were down. The China PPI was up slightly while the China CPI was down slightly. The PMI USA indexes saw steady improvement in Q2 and PMI China saw maintained while PMI Hong Kong was down significantly. Below is a chart of the general trends and for all the details, please see the entire report.

DETAILS
PLASTICS & RUBBER
The cost of the General Purpose plastic resin prices were up marginally in the second quarter with PP, PVC, PS, Food Grade PP, HIPS and HDPE and only PE (LD400) down in price by 2.0%. The PET remained steady. Year over year, the trends for most material were up. PP is up the most (close to 20.00%) followed by PP GP, PS, PVC and HIPS are all up over 8%, and HDPE and PE both up marginally and the PET is steady in prices versus one year ago.

ENGINEERING PLASTICS
Most of the Engineering plastic resin prices were up in second quarter with PC , POM and ABS marginally and only Nylon down in price by 2.6% , the others remains steady. Year over year, PP is up a whopping 28.9% followed by PC up over 10% and Nylon(PA66) and ABS relatively increase a little, while PU Foam is down by 4.5%.Nylon (PA6)is only grade which remains unchanged in price versus one year ago.

RUBBER
Most of the Rubber prices were down in Q2, Latex and CR are both down marginally and only NBR is up by 6.00%, while BR and EPDM are steady. Year over year, CR is up most (over 21%) followed by EPDM is up over 17% and others are all down with Latex and Nature Rubber down over 19% in price versus one year ago.

CARBON STEEL
– For the second quarter of 2018, most of Carbon Steels were up in price with Steel Wire up by 11.5% and the others up marginally. Hot Roll Sheet Tube is exception with a slightly decrease by 2.7% and Cold Roll Steel Tube and Pig Iron is steady. Year over year, the trend is all grades of Carbon Steel go up in price with Pig Iron and Cold Roll Steel Tube up over 23% following by Hot Roll Steel Sheet and Hot Roll Steel Tube up by 18.9% & 17.6%, and the rest are go up all over 8% in price.

STAINLESS STEEL
In Stainless Steel, most grades were down in price between 2% – 7% with #403 down the most while #304É up a little in the second quarter. Year over year, the trend remains up with most grades of stainless steel up in price on average about 9% versus one year ago except for #410 down by 3.3%.

ALUMINUM
Most aluminum grades rose in price in the second quarter while Aluminum 6061 were down close to 6%, and year over year, Aluminum 6061 go down in price by almost 22% and Aluminum 3303 down by 4.9%, while A00 and Aluminum 1060 are slightly increased in price.

INDUSTRIAL METALS
In Other Industrial Metals, only Zinc price was down in Q2 while Nickel was up most (close to 22%) and the rest of metals were up marginally. Year over year, all grades of the prices are up especially Nickel is surged by 54.6% in price versus one year ago.

WOOD
Wood prices are remaining steady in Q2. Year over year, MDF’s price is up over 15% and the others only upmarginally.

PAPER
Most of Paper Materials were up in price in the second quarter with Corrugated Board up in price by 7.8% followed by Kraft Paper, White Cardboard and Gray Cardboard are up marginally and only ArtP aper decreased by 2%. Year-over-year,Corrugated Board and Kraft Paper prices are still higher up by 29.3% and 18.7% respectively. The others are up marginally except for Art Paper is unchanged in price versus one year ago.

TEXTILES
Textile fabric prices saw mixed in the second quarter with 100% Polyester fabric is down over 5% while Raw Cotton is up over 5% and the rest were unchanged. Year over year, all prices is up slightly which 100% Polyester Fabric is up by 8.1% and Raw Cotton andNon-woven PP Fabric are both up over 4% in price versus one yearago.

CERAMIC AND GLASS RAW MATERIALS
In Ceramic Raw Materials, only Alumina’s price was down slightly, while in Glass Raw Materials Soda Ash was up in price over 15% and Glass Sand remain steady. Year over year, the trend of all price is up and the Soda Ash is up most (close to 26%) followed by Feldspar and Kaolin is up on average 14% and the rest up marginally versus one year ago.

FUEL
Fuel prices in China were generally going up in the range of 13% except for China Petroleum is remain steady in the second quarter, and year over year, most of fuels are up significantly high which is up on average 35% versus one year ago except for China Petroleum remained steady. Fuel is an important part of asia manufacturing cost.
OCEAN FREIGHT
Ocean freight rates went up sharply in Q2. Year over year, the average composite index of the WCI, is US $1,375/40ft container, which is $157 lower than the five-year average of $1,532/40ft container all adding to the Asia manufacturing cost.
COST OF LABOR
Most of Asian labor rates saw unchanged while only China labor is up by 5.2% in the second quarter adding to Asia manufacturing costs. Year over year, rates are up in most countries with Indonesia up the most (over 7%) followed by Vietnam, Thailand and China are both up over 5% while Bangladesh saw no change. Cost of labor in India is down significant by 13.5% versus one year ago.
CURRENCY EXCHANGE RATE
For the second quarter, the USD strengthened slightly against the Chinese Yuan, Thai Baht, Bangladesh Taka, India Rupees, Indonesia Rupiah, Taiwan New Dollars and Vietnamese Dong with the Thai Baht, Chinese Yuan, India Rupees and Taiwan New Dollars stronger by over 5%. Year over year, the biggest gains for the USD are against the Indonesia Rupiah and India Rupees while its slightly weaker against the Chinese Yuan and Thai Baht adding to the overall Asia manufacturing cost.
CHINA TRADE (Data lags by one month)
China Imports was decreased by 7.31% while Exports was up by 1.83% in the latest three months. Year over year, China Exports are up by 2% and China Imports are down by over8%. The China Producer Price Index (PPI) is up slightly in the second quarter while the China Consumer Price Index (CPI) down slightly. Year over year, the China PPI is decreased slightly while the China CPI is up slightly versus one yearago.
PURCHASING MANAGERS INDEX (PMI)
Hong Kong PMI is down by over 8% and USA PMI is up slightly. Only China PMI is unchanged in the second quarter. Year over year, China PMI and Hong Kong PMI is down slightly with HK down by over 5% and USA PMI is up slightly versus one year ago.
CONTACT US FOR MORE INFORMATION
Thank you for taking the time to follow trends in Asia manufacturing cost drivers. Source International has operational offices in Louisville, Kentucky & Xiamen, China. Our passion is to partner with companies in supply management from Asia. We have a 30 year on-the-ground track record, a rigorous operating procedure, and a very well trained local staff. We welcome the opportunity to show you how we can add value to your supply chain in Asia and invite you to visit our offices and website to learn more about us. Our Asia manufacturing cost driver report is one example how we can add value and make your supply chain in Asia run more efficiently and consistently.
For additional details, please contact one of our Operations Specialists about Asia manufacturing cost. If you have any suggestions about additions or changes to this report, we’d love your feedback. Thank you for your support.
Visit our Linked-In Page
Data for this report comes from the sources listed and while every attempt is made to be as comprehensive and accurate as possible, please consider that these are just general trends and you should not draw any specific conclusions from the data. We recommend that any information provided in this report be weighed against other sources and experts on the individual topics covered and\, accordingly, we make no specific claims nor assume any liability from the use of the data contained herein.
Comments are closed