Posted by Joe Simon on | Comments Off on Asia Manufacturing Showed Signs of Improvement in Q4-2022
ASIA MANUFACTURING COST DRIVERS REPORT
Q4–2022(Oct.Nov.Dec.)
Tracking The Trends Which Drive Costs in Asia Manufacturing
Executive Summary
Despite supply headwinds, labor shortages, and an uncertain economic environment, Asia manufacturing continues to surpass the expectations of recent years. Manufacturing has demonstrated continued strength in 2022, building on the momentum it gained emerging from the pandemic, and surpassing expectations from the prior two years. While overall demand and production capacity have hit recent highs, there are indications that the near-term outlook may not be as bright. Asia industry is currently experiencing concerns related to inflation and economic uncertainty. In addition, manufacturers continue to grapple with talent challenges that may limit their growth momentum. Moreover, supply chain issues including sourcing bottlenecks, global logistics backlogs, cost pressures, and cyberattacks will likely remain critical challenges in 2023. As leaders look beyond leading amid disruption and revamp their approach, our 2023 manufacturing industry outlook examines five important trends to consider for manufacturing playbooks in the year ahead.
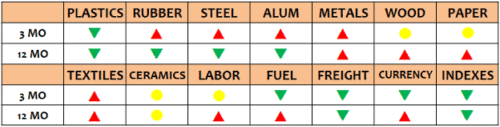
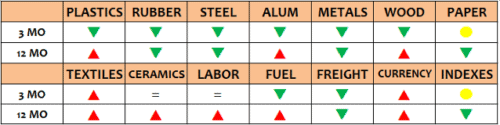
The commodity price trends in the fourth quarter were mixed with plastics, fuel, freight and currency leading the down-in-price group, while rubber, steel, aluminum, other metals, and textiles led the up-in-price group. Meanwhile paper, ceramic materials, and labor costs showed little change. Year over year, plastics, rubber, steel, aluminum, and freight ended the year lower in price than one year ago while metal, wood, paper, textiles, labor, and fuel all saw price increases in the period.
Below is a chart of the overall trends. For all the details, please see the entire report below or download it from the link at the end.
Report Details
PLASTICS & RUBBER
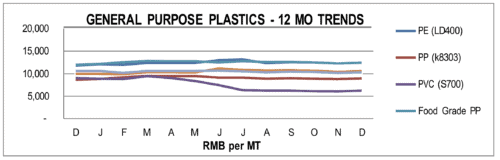
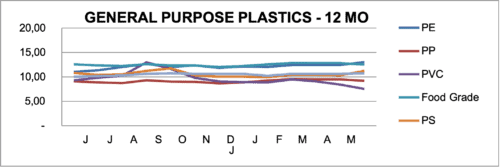
Overall, the General-Purpose plastic resin prices declined in Q4 of 2022 vs Q3 but only slightly. And, in the most recent month of December the trend appears to have reserved with some price increases. Year over year, the results are mixed with PVC, HIPS, HDPE, and PET all showing price declines from 3% to 30%, while EVA, PS, PE and PE all showing increase of 4% to 11% versus one year ago.
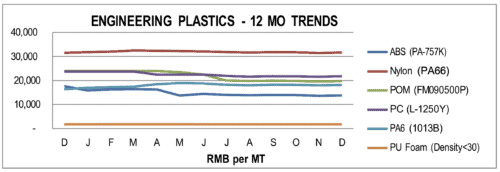
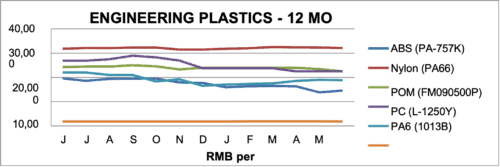
Engineering grade resins displayed a similar trend in Q4 to the General-Purpose grades, with all grades except PU Foam showing price declines, however, they declined less than GP, most less than 1%. Year over year, prices were down on average by 4.5%, led by ABS down 21.8% and POM down17.5% while Nylon increased by 10.3% and Triton and Nylon prices increased slightly, by only about 1% versus 1 year ago.
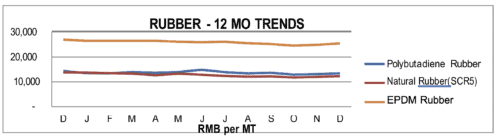
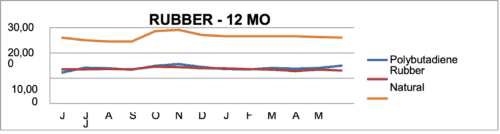
Rubber prices were more mixed in Q4 with the trend generally up on average by about 1.9%. Reclaimed Rubber led the way up 2.6% while Polybutadiene Rubber led the decliners down 2.2%. Year over year, the trends were more mixed, with Neoprene and Nitrile up the most, 27.4% and 18.4% respectively, while Silicon, Natural Rubber, and Latex all showed substantial price declines of 35.7%, 11.5%, and 10.2% respectively versus one year ago.
METALS
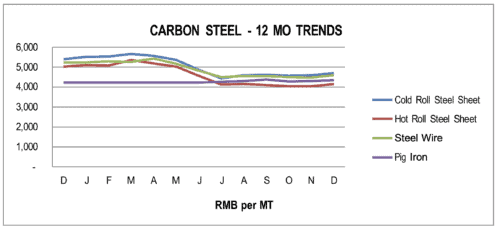
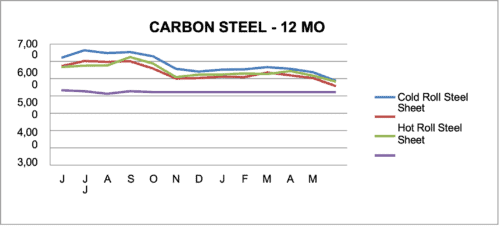
For the fourth quarter of 2022, the prices for most of Carbon Steel grades were up slightly on average about 1% or less versus three months ago with Cold Roll Steel Sheet up the most at 1.7%. Year over year, virtually all carbon steel prices were down on the average 8.6% versus one year ago.
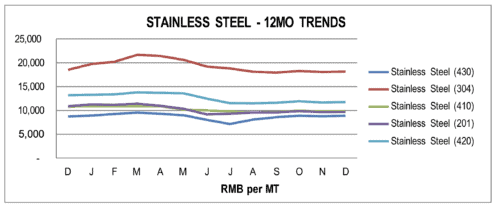
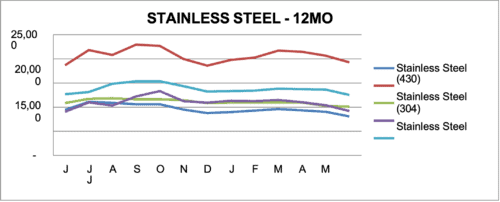
Stainless Steel prices were also up slightly in Q4, on average by 1%-2% compared with last quarter. Year over year, prices were mostly lower than 2021 with 430 and 201 grades down the most on average about 10% versus one year ago
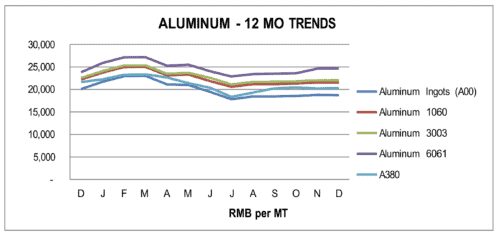
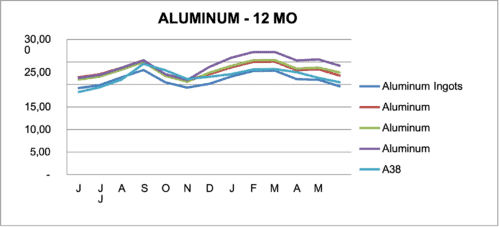
Aluminum prices were higher in Q4, on average by 1%-2%, except 6061 which was up over 5%. Year over year, aluminum prices decreased on the average by 3.2%, however, 6061grade was up 3.6% versus one year ago.
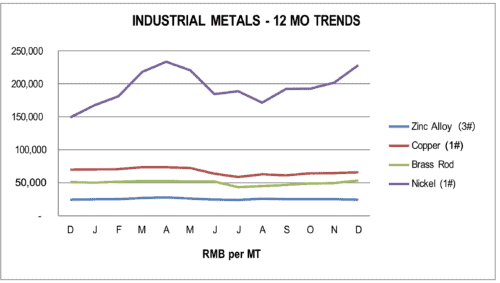
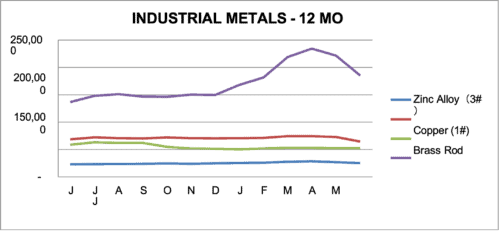
In other Industrial Metals, all showed substantial increases in price led by Nickel (up 18.7% and Brass rods, up 14.3%. Only Zinc bucked the trend, down in price 3.9% versus Q3. Year over year, the prices trends were mixed with Nickel up 53.2%, Brass Rod up 4.8%, while Copper decreased 5.5% and Brass Tubes down 1.9% and Zinc Alloy prices were flat versus one year ago.
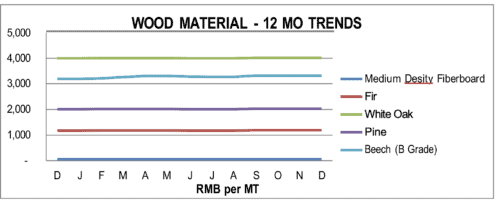
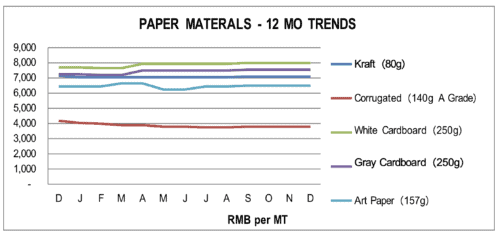
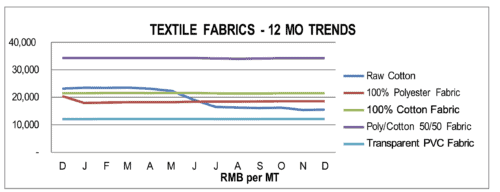
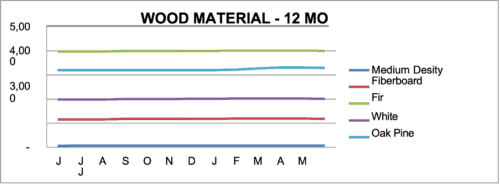
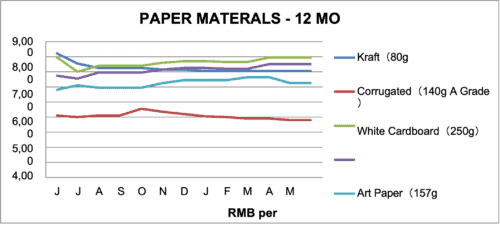
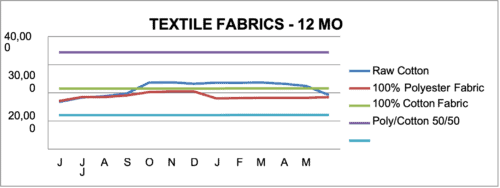
WOOD, PAPER & TEXTILES
Wood prices were flat in Q4 showing little change from Q3. Year over year, with MDF grades up 2% to 5%, Beech up 3.8, Fir up 1.3%, Pine up 1.0%, and White Oak up fractionally versus one year ago.
Most all Paper prices were flat in Q4. Year over year, the trend was more mixed with Kraft down 0.7%, Corrugated down 9.5%, while White Cardboard was up 3.9%, Gray Cardboard was up 4.3% and Art Paper was up 0.8% versus one year ago.
Most Textile fabric prices were up slightly in Q4 by about 1% versus last quarter. Only Raw cotton was down in price 3.7%. Year over year, the price trends were mixed with declines led by Raw Cotton down 32.9% and 100% Polyester Fabric down 9.1%, while Non-woven PP up the most at 6.2% followed by T/C fabric up 2.4%, and PVC fabric up on average by 1% versus one year ago.
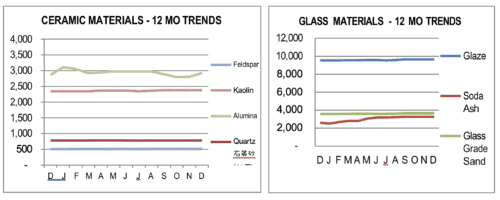
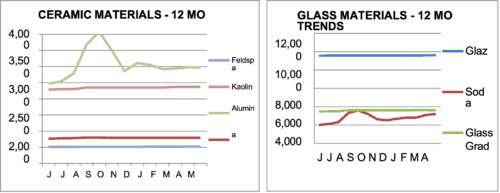
CERAMIC AND GLASS RAW MATERIALS
Ceramic and Glass Raw Materials showed little change over Q3. Year over year, most of the materials were up in price led by Soda Ash up 26.2%, Alumina up 2.3%, Glass Grade Sand and Feldspar up 2%, Kaolin up 1.3% and Quartz was flat versus one year ago.
FUEL
Fuel prices in China moved lower in the 4th quarter led by Diesel declining the most at 10.1%. Year over year, the trend was higher prices for most fuels. up in prices on average 3.9% versus one year ago.
OCEAN FREIGHT
The World Container Index was down 55.7% versus last quarter. Year over year, the World Container Index was down 77% versus one year ago.
COST OF LABOR
Most of the Asian labor rates were unchanged in Dec. Year over year, Labor costs in China were up 4.5%, Vietnam up 5.9%, and Thailand by 5.4%, while Bangladesh labor costs declined 1.2% versus one year ago levels.
CURRENCY EXCHANGE RATE
For the fourth quarter, the USD strengthened against the CNY by 1.9%, however, the Yuan strengthened in December signaling a possible reversal in that trend. Year over year, the USD remained substantially stronger than most of the Asia currencies versus one year ago.
CHINA TRADE (Data lags by one month)
China Imports were up slightly by almost 1% and China Exports increased 3.4% versus December. Year over year, China Imports decreased 7.3% and Exports decreased 10.1% versus one year ago.
The China Consumer Price Index (CPI) was up only slightly 0.2% and the China Producer Price Index (PPI) increased 0.6% in December. Year over year, the China CPI was up 0.3% and China PPI was down almost 10% versus one year ago.
PURCHASING MANAGERS INDEX (PMI)
The China PMI ended Q4 at 47.0, well below the benchmark 50 for an expanding economy and the Hong Kong PMI ended at 49.0, a little bit closer to the 50 mark. The US PMI also remained below 50, with the Manufacturing PMI at 46.2 in December, down from November’s 47.7, while the services PMI activity index fell to 44.4 in December (November: 46.2). Across the private sector, new orders fell at the sharpest pace since May 2020, while new export orders continued to fall, but at a slightly softer pace than in November. Both input and output price inflation eased in December, while employment growth was marginal and business sentiment was pessimistic by historical standards.
CONTACT US FOR MORE INFORMATION
Thank you for taking the time to follow trends in Asia manufacturing. Source International has operational offices in Louisville, Kentucky; Xiamen, China; and Ho Chi Mihm, Vietnam. Our passion is to partner with companies in supply management from Asia. We have a 30+ year on-the-ground track record, a rigorous operating procedure, and a very well-trained local staff. We welcome the opportunity to show you how we can add value to your supply chain in Asia and invite you to visit our offices and website to learn more about us.
For additional details, please refer to the charts that follow or contact one of our Operations Specialists for more information. Thank you for your support.
Dataforthisreportcomesfromthesourceslistedandwhileeveryattemptismadetobeascomprehensiveand accurate as possible, please consider that these are just general trends, and you should not draw any specific conclusions from thedata. Werecommend that any informationprovided inthis report beweighed against other sources and experts on the individual topics covered and\, accordingly, we make no specific claims nor assume any liability from the use of the data contained herein.
Posted by Joe Simon on | Comments Off on Manufacturing Costs Moved Slightly Lower in Q2, 2022
ASIA MANUFACTURING COST DRIVERS REPORT
Q2–2022(April, May, June)
Tracking The Trends Which Drive Costs in Asian Manufacturing
Executive Summary
On average, manufacturing costs moved slightly lower in Q2. Most grades of plastics, rubber, steel, aluminum, metals, wood, fuel, and shipping costs, all were lower in price while only textiles showed an increase and paper was unchanged. Meanwhile, the US dollar strengthened against most major Asian currencies. In China, both imports and exports grew in the quarter while the CPI and PPI were both up and the PMI indexes edged up as well.
While China remains closed to foreign visitors, Vietnam and Thailand have now re-opened their borders to foreign visitors and business people. Overall, manufacturing demand in Asia countries improved in Q2, however, signs are pointing to softer demand as we enter Q3. The continued uncertainty of the COVID pandemic, the possibility of a recession, rising interest rates, and unstable geopolitical events remain the biggest variables having an influence on Asia manufacturing costs. We will be monitoring these in the coming weeks and months as things develop.
Below is a chart of the general trends and for all the details, please see the entire report for all the details:
REPORT DETAILS – Manufacturing Costs Moved Slightly Lower in Q2, 2022
PLASTICS & RUBBER
Prices for general purpose plastic resins were mixed in Q2. PVC prices were down the most at around 15%, followed by HIPS and PP both down around 3%. EVA was up sharply but almost 16%, followed by PS up almost 8%, PE up 5% and PET up 4%. Year over year, the trends are also mixed with EVA up 44%, PE up 18%, HDPE up 7%, followed by PS, PET, and PP up slightly. PVC and HIPS are both down in price 19% and 10% respectively.
Most grades of engineering plastic prices were down in the quarter led by ABS, POM, and PC down 12.%, 7%, and 6% respectively. On the flip side, Nylon was up 7% and Triton was up slightly. Year over year, the major movers were ABS down 26%, PC down 16%, and Nylon down 15%, while most other engineering grade plastic resins were up slightly or unchanged.
Rubber prices in Q2 showed a slight downward trend with Silicon down the most at 33.3%. The other major movers were Natural Rubber down 3% and EPDM down 2% while Nitrile and Neoprene Rubbers rose 11% and 8% respectively. Year over year, the trends are similar with Neoprene Rubber up almost 58% in price, Nitrile up 18% and Polybutadiene Rubber up 23% while Silicon Rubber was down in price almost 36%, Latex Rubber down almost 8%, Natural Rubber down 4% and EPDM Rubber was flat.
METALS
For the second quarter of 2022, the prices for most grades of Carbon Steel were down sharply on average 8% versus Q1. Cold and Cold Rolled Steel were both down around 10% while raw Pig Iron prices were flat. Year over year, most of carbon steels in prices were down on average 10 – 15% versus one year ago.
In the Stainless Steel grades, the trend was similar with prices down on average by 12% versus Q1. Year over year, the trend is mixed with 430 down 14%, 304 up 3%, 410 down 7%, 201 up 2%, and 420 down 1% versus one year ago.
Aluminum prices were down in the second quarter on the average of 13% versus Q1. Year over year, however, most aluminum prices increased on average about 7% versus one year ago led by 6061 up 13% A380 up 12%, and 3003 up 7%.
In other Industrial Metals, the trend was down in Q2 on average by about 10%, led by Nickel down 15%, Brass, down 14%, copper down 13%, and Zinc down 8% versus Q1. Year over year, the average price was up by almost 6% versus one year ago, led by Nickel up 35% and Zinc up11%. Decliners included Brass and Copper both down around 5%.
WOOD, PAPER & TEXTILES
Wood prices were down slightly in Q2, about 1%. Year over year prices are up versus one year ago, with MDF board up 7%, Fir up 3%, White Oak up 1%, Pine up 2% and Beech up 3%.
Paper prices were mostly flat in the second quarter. Year over year, most paper prices are down versus one year ago with Kraft down 15%, Corrugated down 7%, and White Cardboard down 1%, while Gray Cardboard and Art Paper are both up in price 11% and 8% respectively, versus one year ago.
Most Textile fabric prices were up slightly up in Q1 versus than last quarter except Raw cotton which dropped almost 20 in price in the quarter. Year over year, the price trend is up led by Raw Cotton up 15%, Polyester Fabric up about 8%, and PVC Fabric up about 5%, while most other textile fabrics show little change in price versus one year ago.
CERAMIC AND GLASS RAW MATERIALS
Ceramic and Glass Raw Materials saw little change in price in Q2 except Soda Ash which was up by about 14%. Year over year, most of material prices were stable except Soda Ash which was up 60% and Glass Grade Sand up a little over 4% versus one year ago.
FUEL
Fuel prices in China were down in Q2 versus Q1, with Petroleum down 18%, Natural Gas down 17% and LGP Gas down 16%. Year over year, the trend for fuel was up significantly versus one year ago, led by LPG up 33%, followed by Diesel, Petroleum, and Natural Gas up around 25% each
OCEAN FREIGHT
The World Container Index dropped about 15% in Q2 versus last quarter. Year over year, container freight prices are down 15-20% versus 2021.
COST OF LABOR
Most of the Asian labor rates were unchanged in Q2. Year over year, Labor costs in China, Indonesia, and Vietnam were all up around 5%
CURRENCY EXCHANGE RATE
For the second quarter, the USD strengthened against most of the Asia currencies, on average by 5%. The US Dollar finished the quarter versus the China RMB at 6.65:1. Year over year, the USD was stronger against Thai Baht and Bangladesh Taka by 10%, the India Rupee by 6%, China RMB by 4% and the Vietnam Dong by 2%.
CHINA TRADE (Data lags by one month)
China Imports were up 33% and Exports were up 42% in Q2 versus Q1. Year over year, China Imports increased 5% and Exports increased 17% versus one year ago.
PURCHASING MANAGERS INDEX (PMI)
The China and Hong Kong PMI ended the quarter at 50.2 and 51.7 respectively and entered expansion territory for the first time in 2022, while the US PMI ended at 53 to remain in expansion territory (above 50).
CONTACT US FOR MORE INFORMATION
Thank you for taking the time to follow trends in Asia manufacturing. Source International has operational offices in Louisville,Kentucky, Xiamen, China, and Ho Chi Minh, Vietnam. Our passion is to partner with companies in supply management from Asia. We have a three-decade long on-the-ground track record, a rigorous operating procedure, and a very well-trained local staff. We welcome the opportunity to show you how we can add value to your supply chain in Asia and invite you to visit our offices and website to learn more about us.
Data for this report comes from various reliable sources and while every attempt is made to be as comprehensive and accurate as possible, please consider that these are just general trends and you should not draw any specific conclusions from the data. We recommend that any information provided in this report be weighed against other sources and experts on the individual topics covered and, accordingly, we make no specific claims nor assume any liability from the use of the data contained herein.
Asia Manufacturing Costs Rose in the First Quarter of 2022
Tracking The Trends Which Drive Costs in Asia Manufacturing As
Q1– 2022 (Jan, Feb, Mar)
EXECUTIVE SUMMARY
Manufacturing costs trended sharply upward in the first quarter of 2022. Most grades of Plastics, Steel, Alum, Metals, Wood, Textiles, Ceramics increased along with costs for Fuel, and Currency. Only Rubber and Paper decreased in the quarter along with Freight costs which declined 4.8% from elevated levels in most of 2021. The cost of Labor was flat in most Asian countries but rose sharply in China by 4.4%. The major manufacturing Indexes indicated slowed growth and contracting economies with the China PMI index down slightly by 1.6%, while the US PMI was down 2.7% in Q1 vs Q4 of 2021. In China, the largest sector of Asia manufacturing, by far, Imports decreased 6.9% and Exports showed a 18.9% decline versus Q4 2021 levels, while the PPI was down by 1.8% and the CPI showed little change.
Continued COVD shutdowns and the war between Ukraine and Russia are expected to put continued pressures on supply and demand for the balance of 2022.
For all the details please see the entire report that follows:
Q4 EXECUTIVE SUMMARY
After a promising first half of the year, the second half of 2021 proved lackluster for Asia manufacturing. Costs in Q4, 2021 moderated on lower demand and work interruptions caused by COVID outbreaks. These factors coupled with shortages of key semiconductor chips and power restrictions in China led to a decline in production capacity utilization.
The commodity price trends in the fourth quarter showed downward movements in some key materials reversing increases seen in the past few quarters. Most grades of steel, aluminum, plastics, other metals, ceramic raw materials, and fuel all showed price decreases while only rubber, paper, textiles, and other metals all increased slightly. Textiles, and labor costs meanwhile were mostly flat in price. Shippers breathed a sigh of relief in Q4 as the World Container Index declined by 10.4% in Q4 reversing the nearly year-long trend of increasing freight rates. China exports remained strong showing 11.4% increase versus Q3 and economic data showed the world’s second largest economy grew faster than expected between October and December. Numbers from China’s National Bureau of Statistics showed the Chinese economy grew by 8.1% in 2021, slightly below the market’s expectation for around 8.4% growth for the year. China’s producer prices dropped 2.3% from November to December 2021.
Numbers from China’s National Bureau of Statistics showed the Chinese economy grew by 8.1% in 2021, slightly below the market’s expectation for around 8.4% growth for the year. In the fourth quarter, China’s GDP rose 4% from a year ago, topping a Reuters poll that predicted a 3.6% increase. Industrial production also rose and beat expectations, but retail sales had a more muted growth.
The outlook for Asia manufacturing production in the first half of 2022 looks promising with strong demand continuing but with some uncertainty over the direction of new Covid outbreaks, power availability, increased fuel costs, and overall inflationary pressures.
For all the details please see the entire report that follows:
Posted by Joe Simon on | Comments Off on Asia Manufacturing Stalled in Q3, 2021
Asia Manufacturing Stalled in Q3, 2021 Due to Energy Shortages, COVID Outbreaks, Material Supply Constraints, And Transportation Backlogs
Q3 EXECUTIVE SUMMARY –
Asia Manufacturing Stalled in Q3, 2021 Due to Energy Shortages, COVID Outbreaks, Material Supply Constraints, And Transportation Backlogs. Factory output in Asia slowed in the third quarter as manufacturers battled COVID spikes, worker shortages, material supply constraints, and energy shortages. Raw materials continued their upward trends for the most part and transportation backlogs compounded the global supply chain problems.
The commodity price trends in the third quarter all showed upward movements continuing the trend for all of 2021. Most grades of steel, aluminum, other metals, ceramic raw materials, and especially fuel all showed significant increases while only rubber and paper slowed their climb upwards. Wood, textiles, labor costs, and the exchange rate remain stable meanwhile were mostly flat but showing little decline. Freight costs continued their move upward with The World Container Index up 46.02% over Q2 reaching all-time highs.
Chinese imports were up 4% and exports were up over 8% versus Q2. And, while the CPI declined slightly, the PPI has risen over 9% this year hitting a 13-year high. The China PMI index was at 49.6 in September versus 50.1 in August slipping into contraction for the first time since February 2020.
Unfortunately, the outlook for Q4 does not have many promising signs for quick relief and a continuation or worsening of prices is likely as we move into the holiday season. Demand remains strong from both North America and Europe, and it remains to be seen if rising prices will temper that demand into 2022.
For all the details please see the entire report that follows:
Posted by Joe Simon on | Comments Off on Asia Manufacturing Costs Higher in Q2 – 2021
Asia Manufacturing Costs Increased in Q2-2021 Driven by Supply Chain Disruptions, Raw Material Increases, and Higher Transportation Costs
Q2 EXECUTIVE SUMMARY – Asia Manufacturing Costs saw sharp rises in raw material costs and strains in supply chains in Q2. Meanwhile, contrained output and the spread of new COVID variants (especially in India) fueled further negative impact on productivity and supply chains. These factors coupled with logistics issues at Asian and US ports and surges in transportation costs are further complicating the situation and driving higher prices.
The commodity price trends in the second quarter all showed significant upward movements continuing the trends of the past few quarters. Most grades of steel, aluminum, other metals, ceramic raw materials, and fuel all showed increases while only plastics and paper retreated slightly from significant increases earlier in the year. Wood, textiles, and labor costs meanwhile were mostly flat in price. The World Container Index increased by 19.6% in Q2 continuing the uptick in logistics costs this year and was by far the highest in recent years. China exports surged 16.7% versus Q1 reflecting the strong demand in the marketplace with heavy order volume. China’s producer prices rose by 8.8% year-on-year in June 2021 after a 9.0% gain in May and was the sixth straight month of increases in factory prices.
The outlook for Asia manufacturing production in the second half of 2021 continues to be strong led by the rapid expansion forecast for world economic growth of around 5% year over year.
For all the details please see the entire report that follows:
Posted by Joe Simon on | Comments Off on Manufacturing Cost Drivers Report For Q1 2021
Tracking The Trends Which Drive Costs In Asian Manufacturing
Executive Summary
The commodity price trends in the first quarter were increased in Asia. Most of grades were increased in Plastic, Rubber, Steel, Alum, Metals, Paper, and Freight. Only Fuel was down in price in this quarter, US Dollar was only up 0.79% of the CNY than last quarter. Textiles and Ceramic were mostly flat in price. The trend for World Container Index was increased in Q1 by 26.2%. Both China imports and exports were decreased by 13.32% and 23.58% than three months ago. The China CPI was almost kept flat in Q1. The China PMI indexes were kept flat in Q1, the US PMI was up by 6.59% in Q1. Below is a chart of the general trends and for all the details, please see the entire report.
Report Details
PLASTICS & RUBBER
– Most General plastic prices were up in Mar., except PVC(S700) was down 3.13% and PS (688B) was down 1.01%. Year over year, most of general plastic prices were up on average of 25.35%, PE(LD400) was up 78%, Chi Mei PH88 was up 51.49%, PVC(S700) was up 55% than last year.
-Generally, the engineering plastic prices were most up in Mar. than one month ago. PC (L-1250Y) was up 8.7%, PA6 (1013B) was up 13.16%, Nylon (PA66) was up 5.67%. Year over year, ABS (PA-757K) increased 55.37%, and PA6 (1013B) increased 10.26%.
– For the Rubber prices in Q1, most of them were increased. Polybutadiene Rubber (BR9000) was up 30.48%, Natural Rubber (SCR5) was down by 15.24% than last month, however it increased 4.51%. EPDM Rubber was greatly up 18.18% and 50.29% up than last quarter. Year over year, Polybutadiene Rubber (BR9000) was up 65.06%, Natural Rubber (SCR5) and EPDM Rubber were up by 41.84% and 85.71%.
METALS
– For the first quarter of 2021, the prices for most of Carbon Steel were up. Cold Roll Steel Sheet was up 3.06% in Mar., Hot Rolled Steel Plate increased 7.27%, and Steel Wire was up 3.67%. Pig Iron was down 1.26% however it increased 7.67% than last quarter. Year over year, most of carbon steels in prices were up on the average 35.23% versus one year ago.
– In the Stainless Steel part, most of the grades of prices were up in the first quarter by average 6.65%, even though they were down average 2.33% in Mar. than last month. Year over year, 430 up 38.62%, 304 up 24.19%, 410 up 40.26%, 201 up 23.61%, and 420 up 26.09% versus one year ago.
– The aluminum prices were up on the average of 6.18% in the first quarter. Year over year, all aluminum prices increase on the average 38.40% as well versus one year ago. A00 was up 49.45%, 1060 was up 40.55%, 3003 was up41.90%, 6061 was up 40.84% and A380 was up 29.68%.
– In other Industrial Metals, the trend was up in Q1, average up 6.07%. However Zinc Alloy decreased 1.03% than last month. Year over year, the average up 54.42% versus one year ago, Brass rod increased 86.09%, Copper increased 70.23%, Zinc Alloy increased 39.18% and Nickel increased 34.24%.
WOOD, PAPER & TEXTILES
– Wood prices were steady in Q1.Year over year, MDF and Fir were kept flat, Beech wood was down 0.62%. However, the White Oak was up 4.75% versus one year ago.
– All of the prices of Paper Materials were up in Q1, by average 17.06%. Gray Cardboard was up 25.91%, White Cardboard was up 21.77% and Corrugated and Art Paper were up more than 17%. Year over year, Paper Materials were up by average 23.24% versus one year ago.
– Textile fabric prices were mostly unchanged in the first quarter, except Raw Cotton in price was up 3.16% than last quarter but down back 7.04% than Feb. Polyester (Fuzhou) was up 29.86% in this quarter. Year over year, Raw Cotton was up 34.65%, and Polyester (Fuzhou) was up 35.66% versus one year ago.
CERAMIC AND GLASS RAW MATERIALS
-In Ceramic and Glass Raw Materials, most of the materials were kept steady in Q1. However, Soda Ash obviously increased 29.03%. Year over year, Soda Ash was up 17.65% versus one year ago.
FUEL
Fuel prices in China were decreased in this Q1, with Petroleum Price was down 4.45%, Natural Gas price was down 4.11% and LGP gas was down 2.51%. However, year over year, the trend for the grades were up in prices on average 49.55% versus one year ago.
OCEAN FREIGHT
The World Container Index was up 26.19% in the first quarter. Year over year, the World Container Index was up 207% versus one year ago.
COST OF LABOR
Most of the Asian labor rates were unchanged in Q1. Year over year, India and Indonesia were up 22.54%, 3.27% respectively.
CURRENCY EXCHANGE RATE
For the first quarter, the USD was strengthened against by average 1.67%, to against the CNY by 0.79% up than last quarter, against INR 1.47% and THB 4.86%. Year over year, the USD was weakened against the CNY 7.25%, against IDR by 11.27%.
CHINA TRADE (Data lags by one month)
– China Imports was down 13.32% than last quarter and at the same time, China Exports was down 23.58% in the first quarter. Year over year, China Imports increased 11.41% and Exports increased 39.88% versus one year ago.
– The China Consumer Price Index (CPI) was only up 0.3%. And China Producer Price Index (PPI) increased greatly by 213.33% in the first quarter. Year over year, the China CPI was down 5.13% and China PPI was up 525% versus one year ago.
PURCHASING MANAGERS INDEX (PMI)
The PMI China was kept flat in this quarter, and PMI Hong Kong was down 4.53%. PMI US was up obviously by 6.59% in Q1. Year over year, PMI China was down 0.19% and Hong Kong was up 1%, PMI US was up 31.77% versus one year ago.
CONTACT US FOR MORE INFORMATION
Thank you for taking the time to follow trends in Asia manufacturing. Source International has operational offices in Louisville, Kentucky & Xiamen, China. Our passion is to partner with companies in supply management from Asia. We have a 27 year on-the-ground track record, a rigorous operating procedure, and a very well trained local staff. We welcome the opportunity to show you how we can add value to your supply chain in Asia and invite you to visit our offices and website to learn more about us.
For additional details, please refer to the charts that follow or contact one of our Operations Specialists for more information. Thank you for your support.
Data for this report comes from the sources listed and while every attempt is made to be as comprehensive and accurate as possible, please consider that these are just general trends and you should not draw any specific conclusions from the data. We recommend that any information provided in this report be weighed against other sources and experts on the individual topics covered and\, accordingly, we make no specific claims nor assume any liability from the use of the data contained herein.
Posted by Joe Simon on | Comments Off on Manufacturing Cost Drivers Report For Q4 2020
The commodity price trends in the fourth quarter were increased in Asia. Most of grades were increased in Plastic, Rubber, Steel, Alum, Metals, Paper, Fuel and Freight. Only Currency was down in price in this quarter, US Dollar was down 3.27% of the CNY then last quarter. Textiles, Ceramic and Labor were mostly flat in price. The trend for World Container Index was increased in Q4 by 54.9%. Both China imports and exports were increased. The China CPI was down 1.47% in Q4. The China PMI indexes were kept flat in Q4, the US PMI was up 9.57% in Q4. Below is a chart of the general trends and for all the details, please see the entire report.
PLASTICS & RUBBER
– Most General plastic prices were down in Dec., especially PS (688B) was down 19.09%. Year over year, most of general plastic prices were up on average of 9.21%, PE(LD400) was up 45.57%, Chi Mei PH88 was up 33.33%, PVC(S700) was up 13.7% than last year.
-Generally, the engineering plastic prices were most up in the Fourth quarter. ABS (PA-757K) increased 27.08%, and down 7.58% in Dec. Nylon (PA66) was up 5.12%, POM (FM090500P) was up 0.42%, PC (L-1250Y) was up 5.5%. PU Foam (Density<30) kept flatly. PA6 (1013B) was down 2.11%. Year over year, ABS (PA-757K) increased 40.77%, however, Nylon (PA66) decreased 12.88%.
– Most of the Rubber prices were increased in Q4, Polybutadiene Rubber (BR9000) was up 20.69%, Natural Rubber (SCR5) increased greatly by 9.02%, EPDM Rubber was up 20.98%. Year over year, Polybutadiene Rubber (BR9000) was down 5.41%. However Natural Rubber (SCR5) and EPDM Rubber were up by 9.47% and 18.49%.
METALS
– For the fourth quarter of 2020, the prices for most of Carbon Steel were up. Cold Roll Steel Sheet was up 24.03%, Hot Rolled Steel Plate increased 20.9%, and Steel Wire was up 11.86%. Pig Iron was up 23.73%. Year over year, most of carbon steels in prices were up on the average 21.26% versus one year ago.
– In the Stainless Steel part, most of the grades of prices were up in the fourth quarter, with 430 increased 20.08%, 410 up 12.94%, 201 up 12.58%, 420 up 15.02%. 304 was down by 1.25%. Year over year, 430 up 17.5%, 410 up 21.52% 201 up 8.97%, 420 up 15.57% versus one year ago.
– The aluminum prices were up on the average of 11.21% in the fourth quarter. Year over year, all aluminum prices increase on the average 11.84% as well versus one year ago.
– In other Industrial Metals, the trend was up in Q4, average up 13.57%, Zinc Alloy increased 10.99%, Nickel increased 14.25%, Copper increased 14.77%, Brass Rod increased 18.05%. Year over year, the average up 16.46% versus one year ago.
WOOD, PAPER & TEXTILES
– Wood prices were steady in Q4, however, the White Oak was up 4.75%.Year over year, MDF was down by 1.56% and Beech wood was down 2.17%, conversely, the White Oak was up 4.75% versus one year ago.
– Most of the prices of Paper Materials were up in Q4, Gray Cardboard was up 14.09%, Art Paper was up 12.73% and White Cardboard was up 11.41%. Kraft and Corrugated were kept steady. Year over year, Paper Materials were up by average 9.12% versus one year ago.
– Textile fabric prices were mostly unchanged in the fourth quarter, except Raw Cotton in price was up 14.63%. Meanwhile, year over year, Raw Cotton was up 13.04%, 100% Polyester Fabric was down 5.56% versus one year ago.
CERAMIC AND GLASS RAW MATERIALS
-In Ceramic and Glass Raw Materials, most of the materials were kept steady in Q4, However, Alumina was up 1.3% and Soda Ash obviously decreased 18.42%. Year over year, Alumina was down 4.10% and Soda Ash was down 6.06% respectively versus one year ago.
FUEL
Fuel prices in China were increased in this Q4, with Petroleum Price was up 63.95%, LGP gas was up 53.13% and Natural Gas prices was up 56.23%. However, year over year, the trend for the grades were down in prices on average 17.96% versus one year ago.
OCEAN FREIGHT
The World Container Index was up 54.86% in the fourth quarter. Year over year, the World Container Index was up 174% versus one year ago.
COST OF LABOR
Most of the Asian labor rates were unchanged in Q4. Year over year, India, Indonesia and Vietnam were up 11.18%, 8.63% and 5.74% respectively.
CURRENCY EXCHANGE RATE
For the fourth quarter, the USD was weakened against by average 2.1%, to against the CNY by 3.27%, against IDR 4.97% and THB 4.12%. Year over year, the USD was weakened against the CNY 6.54%, against TWD by 6.15%. The USD strengthened against INR 2.73%.
CHINA TRADE (Data lags by one month)
– China Imports was up 9.25%, and at the same time, China Exports was up 13.95% in the fourth quarter. Year over year, China Imports increased 5.26% and Exports increased 20.90% versus one year ago.
– The China Consumer Price Index (CPI) was down 1.47%. And China Producer Price Index (PPI) was up 1.74% in the fourth quarter. Year over year, the China CPI is down 4.11% and China PPI was up 0.1% versus one year ago.
PURCHASING MANAGERS INDEX (PMI)
The PMI China was up 0.78%, PMI Hong Kong was unchanged. PMI US was up obviously by 9.57% in Q4. Year over year, PMI China was up 3.39% and Hong Kong was up 2.91%, PMI US was up 28.6% versus one year ago.
CONTACT US FOR MORE INFORMATION
Thank you for taking the time to follow trends in Asia manufacturing. Source International has operational offices in Louisville, Kentucky & Xiamen, China. Our passion is to partner with companies in supply management from Asia. We have a 27 year on-the-ground track record, a rigorous operating procedure, and a very well trained local staff. We welcome the opportunity to show you how we can add value to your supply chain in Asia and invite you to visit our offices and website to learn more about us.
For additional details, please refer to the charts that follow or contact one of our Operations Specialists for more information. Thank you for your support.
Data for this report comes from the sources listed and while every attempt is made to be as comprehensive and accurate as possible, please consider that these are just general trends and you should not draw any specific conclusions from the data. We recommend that any information provided in this report be weighed against other sources and experts on the individual topics covered and\, accordingly, we make no specific claims nor assume any liability from the use of the data contained herein.
Posted by Joe Simon on | Comments Off on Manufacturing Cost Drivers Report For Q3 2020
The commodity price trends in the third quarter were increased in Asia. Most of grades were increased in Rubber, Steel, Alum, Other metal, Paper, Ceramics, Fuel, Freight. Only Plastics was down in price in this quarter. Wood, Textiles were mostly flat in price, and Labor rates were steady in the lower wage countries. The Currency was down in this quarter too, US Dollar was down about 3% of the CNY then last quarter. The trend for World Container Index was increased in Q3. Both China imports and exports were increased. The China CPI was kept flat, the China PPI was increased slightly. The China PMI indexes were kept flat in Q2, the US PMI was up 5% in Q3. Below is a chart of the general trends and for all the details, please see the entire report.
PLASTICS & RUBBER
Most General plastic prices were up in Sept, especially PE (LD400) was up 8.33%. Year over year, most of general plastic prices were down on average of 21.7%, PP (k8303) was down 3.8%, Food Grade PP was down 2.9%, PS (688B) was down 14.8%. However, PVC (S700) was up 1.4%, PE (LD400) was up 12.1% than last year.
Some of engineering plastic prices were down in the Third quarter, only ABS (PA-757K) increased 12.5%. PC (L-1250Y) was down 14.5%. Year over year, PC (L-1250Y) was down 23.2 %, following is Nylon (PA66) down 17%. ABS (PA-757K) increased 9.9%. PU Foam (Density<30) kept flatly.
Most of the Rubber prices were increased in Q3, Polybutadiene Rubber (BR9000) was up 6.1%, Natural Rubber (SCR5) increased greatly by 20.8%, EPDM Rubber was up 7.5%. Year over year, Polybutadiene Rubber (BR9000) was down 29.8%, and EPDM Rubber was down 5.3%. Natural Rubber (SCR5) increased 9.9%.
METALS
For the third quarter of 2020, the prices for most of Carbon Steel were up. Cold Roll Steel Sheet was up 9.1%, Hot Rolled Steel Plate increased 3.6%, and Steel Wire was up 6.7%. Pig Iron was steady. Year over year, most of carbon steels in prices were up on the average 1.2% versus one year ago.
In the Stainless Steel part, most of the grades of prices were up in the third quarter, with 430 increased 10%, 304 increased 9.2%, 201 up 2.0% and 420 up 6.5%, 410 kept flatly. Year over year, 410 increased 7.6%, conversely, 430/304 and 201 was down about 5% versus one year ago.
The aluminum prices were up on the average of 4.6% in the third quarter. Year over year, all aluminum prices increase on the average 4.6% as well versus one year ago.
In other Industrial Metals, the trend was up in Q3, average up 7.8%, especially, Zinc Alloy increased 14.4%, Nickel increased 11.4%. Year over year, Copper and Brass Rod was up on average 8.7%, Zinc Alloy was up 2.5%. Conversely, Nickel was down 18% versus one year ago.
WOOD, PAPER & TEXTILES
Wood prices were steady in Q3.Year over year, most of wood prices were slightly down by average 0.9% versus one year ago.
Most of the prices of Paper Materials were up by average 7.3%, Kraft Paper and Art Paper were kept steady. Year over Year, Kraft Paper and Art Paper were down 1.5%. Conversely, Corrugated was up 12%, White and Gray Cardboard were up 5% versus one year ago.
Textile fabric prices were mostly unchanged in the third quarter, except Raw Cotton in price was up 8.1%. Meanwhile, year over year, most of Textile prices keep steady, while Raw Cotton was up 1.7%, 100% Polyester Fabric was down 5.6% respectively versus one year ago.
CERAMIC AND GLASS RAW MATERIALS
In Ceramic and Glass Raw Materials, most of the materials were up in Q3, However, Soda Ash obviously increased 40.7%, was bounce back half from last quarter (dropped 20.6% in Q2), and followed by Alumina in price were up 3.1%. Year over year, Soda Ash was up 2.7%, and Alumina are down 10.5% respectively versus one year ago.
FUEL
Fuel prices in China were increased in this Q3, with Petroleum Price was up 36.3%, LGP gas was up 10.5% and Natural Gas prices was up 9.1%. Conversely, China Industrial Electric was down 9.5% and China Diesel Oil down 5.4%. However, year over year, the trend for the grades were down in prices on average 23.4% versus one year ago.
OCEAN FREIGHT
The World Container Index was up 42.8% in the third quarter. Year over year, the World Container Index was up 112% versus one year ago.
COST OF LABOR
Most of the Asian labor rates were unchanged in Q3. Year over year, Indonesia and Vietnam were up 8.6% and 5.7% respectively.
CURRENCY EXCHANGE RATE
For the third quarter, the USD was weakened against the CNY by 4.79%, against INR and TWD on average 2.68%. The USD was strengthened slightly against IDR by 2.73%. Year over year, the USD was weakened against the CNY/INR/TWD by average 6%. The USD strengthened against IDR 4.01% and against THB by 2.51%.
CHINA TRADE (Data lags by one month)
China Imports was up 21.3%, and at the same time, China Exports was up 12.26% in the third quarter. Year over year, China Imports increased 13.65% and Exports increased 9.93% versus one year ago.
The China Consumer Price Index (CPI) was kept steady. And China Producer Price Index (PPI) was down by average 1.77% in the third quarter. Year over year, the China CPI is down marginally 0.39% and China PPI was down 1.2% versus one year ago.
PURCHASING MANAGERS INDEX (PMI)
The PMI China was up 1.18%, PMI Hong Kong was up 4.73%. PMI US was up obviously by 5.32% in Q3. Year over year, PMI China was up 3.41% and Hong Kong was up 5.36%, PMI US was up 15.9% versus one year ago.
CONTACT US FOR MORE INFORMATION
Thank you for taking the time to follow trends in Asia manufacturing. Source International has operational offices in Louisville, Kentucky & Xiamen, China. Our passion is to partner with companies in supply management from Asia. We have a 27 year on-the-ground track record, a rigorous operating procedure, and a very well trained local staff. We welcome the opportunity to show you how we can add value to your supply chain in Asia and invite you to visit our offices and website to learn more about us.
For additional details, please refer to the charts that follow or contact one of our Operations Specialists for more information. Thank you for your support.
Data for this report comes from the sources listed and while every attempt is made to be as comprehensive and accurate as possible, please consider that these are just general trends and you should not draw any specific conclusions from the data. We recommend that any information provided in this report be weighed against other sources and experts on the individual topics covered and, accordingly, we make no specific claims nor assume any liability from the use of the data contained herein.
Posted by Joe Simon on | Comments Off on Manufacturing Cost Report For Second Quarter 2020
The commodity price trends in the second quarter are mixed in Asia. Some grades of Plastics and Rubber were down in price while some grades were up or maintained the price. Steel, Alum, Metals and Freight were mostly up in prices. Paper and Fuel were mostly down in price. Wood, Textiles and Ceramics were mostly flat in price, and labor rates were steady in the lower wage countries. The trend for World Container Index was increased in Q2. The US Dollar was slightly down of the Asian currencies in Q2. Affected by Covid-19 in the world, China imports declined in this quarter, while exports increased faintly than Q1. The China CPI and PPI were slightly down. The China PMI indexes kept flat in Q2 and the US PMI was obviously up in June in Q2.
PLASTICS & RUBBER
Most General plastic prices were down in April, but bounced back in May and June. Especially PP (k8303) was up 14.3%, PE (LD400) was up 11.3%, and PP (Food Grade) was up 10.3%. Year over year, most of the general plastic prices are down on the average of 10.75%, PS (688B) is decreased over 25%, HDPE is decreased 16.3% versus one year ago.
Some of engineering plastic prices were down in the Second quarter. Nylon (PA66) /PC (L-1250Y) decreased 6.5%. However, ABS (PA-757K) increased 5.8%, while PU Foam (Density <30) was unchanged. Year over year, PC (L-1250Y) is down 13.6%, following is Nylon (PA66) down 9.1%.
Some of the Rubber prices were down in Q2, EPDM Rubber was down 5%, and Polybutadiene Rubber (BR9000) was down 1.2%. Conversely, Natural Rubber (SCR5) increased 3.1%. Year over year, Most of rubber prices are down, average is down 10%.
METALS
For the second quarter of 2020, the prices for most of Carbon Steel were up. Hot Rolled Steel Plate increased 7.2%, Cold Roll Steel Sheet was up 4.2% and Steel Wire was up slightly by 0.8%. Pig Iron was steady. Year over year, most of carbon steels in price are down on the average 3.6% versus one year ago.
In the Stainless Steel part, all of the grades of prices were up in the second quarter, with 410 increased 10.4%, 304 up 6.1%, and 201 up 2.8%. Conversely, 420 and 430 decreased 3.4%. Year over year, most of the Stainless Steel prices are down, with 201 prices sharply down over 12.9%, and 430 down 11.9%, average 5.1% down versus one year ago.
The aluminum prices were up on the average of 12.4% in the second quarter, with Aluminum Ingots (A00) up over 20%. Year over year, all aluminum prices increase slightly with average 0.8% versus one year ago.
In other Industrial Metals, the trend was up in Q2, average up 18.7%, especially, Brass Rod was up 31.6%, and Copper increased 25.1%. Year over year, only Zinc Alloy is down 18.7% versus one year ago.
WOOD, PAPER & TEXTILES
Wood prices were steady and unchanged in Q2, only Beech was down 2.8%. Year over year, most of wood prices are slightly down by average 0.9% versus one year ago.
Most of the prices of Paper Materials were down by average 6.5%, only Kraft Paper kept steady. Gray Cardboard was down 9.0%. Year over Year, the trend of paper price is down, too, by average 6.2%. Gray Cardboard is down 10.6% versus one year ago.
Textile fabric prices were mostly unchanged in the second quarter, except Raw Cotton in price was up 5.3%. Conversely, 100% Polyester Fabric decreased by 5.6%. Meanwhile, year over year, most of Textile prices keep steady, while Raw Cotton and 100% Polyester Fabric are down 15.5% & 10.5% respectively versus one year ago.
CERAMIC AND GLASS RAW MATERIALS
In Ceramic and Glass Raw Materials, most of the materials were unchanged in Q2, However, Soda Ash obviously dropped 20.6%, and followed by Alumina in price were down 5.9%. Year over year, Soda Ash and Alumina are down 32.5% & 29.6% respectively versus one year ago.
FUEL
Fuel prices in China were sharply decreased, with Petroleum Price and Natural Gas prices were obviously down 29% and 11% in the second quarter. Diesel Oil increased slightly by 1.8%. Industrial Electric was unchanged. Similarly, year over year, the trend for the grades are down in price, with Petroleum Price in price is largely down to 43.2%, followed by Natural Gas price declined 26.6% versus one year ago.
OCEAN FREIGHT
The World Container Index was up 17.6% in the second quarter. Year over year, the World Container Index is up 39% versus one year ago.
COST OF LABOR
Most of the Asian labor rates were unchanged in Q2. Similarly, year over year, rates are mostly keeping steady. Vietnam and Thailand prices are up 5.7% & 1.8% respectively.
CURRENCY EXCHANGE RATE
For the second quarter, the USD weakened against the Indonesian Rupiah by 12.3% and Thailand Baht by 5.28%. The USD strengthened slightly against Bangladesh Taka. Year over year, the USD strengthen against most of the Asian countries, except Taiwan New Dollars, Vietnam Dong and Japanese Yen.
CHINA TRADE (Data lags by one month)
China Imports was down 4%. Conversely, China Exports was up 41.22% in the second quarter. Year over year, China Imports obviously decrease 19.93% and Exports are down 3.27% versus one year ago.
The China Consumer Price Index (CPI) and China Producer Price Index (PPI) were all down by average 3% in the second quarter. Year over year, the China CPI is down marginally and China PPI is down 4.3% versus one year ago.
PURCHASING MANAGERS INDEX (PMI)
The PMI China was down 2.12%, PMI Hong Kong was up 2.2%. PMI US was up obviously by 7.13% in Q2, with June increased 22.04% than May. Year over year, both PMI China and Hong Kong are up above 3%, PMI US is up 1.74% versus one year ago.
CONTACT US FOR MORE INFORMATION
Thank you for taking the time to follow trends in Asia manufacturing. Source International has operational offices in Louisville, Kentucky & Xiamen, China. Our passion is to partner with companies in supply management from Asia. We have a 27 year on-the-ground track record, a rigorous operating procedure, and a very well trained local staff. We welcome the opportunity to show you how we can add value to your supply chain in Asia and invite you to visit our offices and website to learn more about us.
For additional details, please refer to the charts that follow or contact one of our Operations Specialists for more information. Thank you for your support.
Data for this report comes from the sources listed and while every attempt is made to be as comprehensive and accurate as possible, please consider that these are just general trends and you should not draw any specific conclusions from the data. We recommend that any information provided in this report be weighed against other sources and experts on the individual topics covered and, accordingly, we make no specific claims nor assume any liability from the use of the data contained herein.
Posted by Joe Simon on | Comments Off on Manufacturing Cost Report For First Quarter 2020
Tracking The Trends Which Drive Manufacturing Costs In Asia
In the first quarter of 2020, as a result of the impact of covid-19 virus, most commodities and manufacturing costs in the Asia region moved lower.
Manufacturing cost drivers for the entire quarter are summarized in the chart above. Leading to the decline in manufacturing costs for the first quarter of 2020 were much lower raw material prices. Most grades of Plastics, Rubber, Steel, Alum, Metals, Textiles, Ceramics and Fuel were down in price, while Wood price was flat, and only a few select grades of Paper prices went lower. Most of the Asian labor rates were unchanged in Q1 with the Lunar New Year season but some countries labor rates actually went down. The trend for World Container Index saw lower ocean freight costs while airfreight was in huge demand and was being priced on the spot market. The US Dollar remained strong against all of the Asian currencies in Q1 but, influenced by COVID-19, China imports and exports saw sharp declines in the quarter. The China CPI and PPI were also down marginally and the PMI indexes were down in February and rebounded in March. Much of China went back to work in late March with strict social distancing restrictions remaining in place.
READ ABOUT THE DETAILED ANALYSIS OF THE MANUFACTURING COST DATA
Posted by Joe Simon on | Comments Off on ASIAN MANUFACTURING COST REPORT Q4– 2019
Executive Summary
Asian manufacturing commodity price trends in the fourth quarter were again mixed. Many grades of Plastics, Steel and Ceramics were mostly down in price. While some grades of Rubber, Alum, Paper, Textiles and Fuel prices were all up. Labor rates were steady in the lower wage countries. Freight rates according to the World Container Index increased substantially. Metal and Wood prices were mixed. The US Dollar was down a little bit against most of the Asian currencies in Q4. China imports and exports saw slightly up in this quarter. The China CPI and PPI were up marginally. The PMI indexes saw slightly down in Q4, PMI China saw slightly up, while PMI Hong Kong and PMI USA decreased slightly. Below is a chart of the general trends and for all the details on the cost drivers of Asian manufacturing, please see the entire report.
Asian Manufacturing Cost Drivers Report Details-2019 Q4
PLASTICS & RUBBER
– Most of General Purpose plastic prices were steady in the fourth quarter. Expect for the prices for PE (LD400) and PS (688B) were down on the average of 8.7%. Year over year, most of the general plastic prices are down, with PVC (S700) decreased marginally 1%, PS (688B) is down over 20%. Only PET (SE-3030) is unchanged versus one year ago.
-The fourth quarter of engineering plastic prices was mixed. Nylon (PA66) was slightly increased 0.1% and PU Foam (Density<30) was up 0.5%, PC (L-1250Y), POM (FM090500P) and ABS (PA-757K) were down on the average of 0.8%, while Nylon (PA6) was unchanged. Year over year, PC (L-1250Y) is down most in price which is over 9%, followed by ABS (PA-757K) down 7.8%. While Nylon (PA66) and POM prices are increase slightly. Only PU Foam (Density<30) is steady versus one year ago.
– Most of the Rubber prices were up in Q4, Latex Rubber saw obviously up which was over 11%. Polybutadiene Rubber was down most in price, which was over 10.5%. NBR price was steady. Year over year, expect for NBR price is unchanged, most of rubber prices are down, with CR, EPDM prices are sharply down on the average of 16%, followed by Polybutadiene Rubber prices are down 3.5%.
METALS
– For the fourth quarter of 2019, the prices for Carbon Steel were mixed. Cold Roll Steel Sheet and Hot Roll Steel Sheet prices were up 3% and 2.8% respectively, while Cold Roll Steel Tube was down 2.3% in price and Steel Wire price was down 5.6%. Pig Iron was steady. Year over year, most of carbon steels in price are up on the average 6.3% versus one year ago.
– In the Stainless Steel part, most of the grades of prices were down in the fourth quarter, with 304, 201 and 430 in price down 6%, 1.9% and 0.6% respectively, while 420 prices were up 0.5%. Year over year, most of the Stainless Steel prices are down, with 201 and 410 prices sharply down over 10%, followed by 430 prices down slightly versus one year ago.
– Most of aluminum prices were up on the average of 3.7% in the fourth quarter, while Aluminum 3003 was down 0.6%. Year over year, All aluminum prices are up, with Aluminum 6061 is up over 10% versus one year ago.
– In other Industrial Metals, the trend was mixed in Q4, with Nickel in price was significantly down 17.9%, and the prices for Copper and Brass Rod were both up over 5%. Only Zinc in price was down slightly 2%. Conversely, year over year, Nickel price is significantly up 26.7%, And Zinc price is sharply down 15.5% while Copper and Brass Rod are up 2.1 and 9.6% respectively versus one year ago.
WOOD, PAPER & TEXTILES
– Wood prices in Asian manufacturing were mixed in Q4, with Beech Hardwood was up 1.6%, while MDF prices were down 3%. Similarly, year over year, Wood prices are mixed, and Pine Softwood is unchanged versus one year ago.
– Most of grades prices of Paper Materials were up in the fourth quarter, expect for Kraft Paper in price was down 2.7%, the rest of grades prices were up on the average of 3.8%. Year over year, the trend for paper price is decreasing, with Art Paper and Corrugated Board both enormously down over 12%, White Cardboard is down faintly. While Kraft paper and Gray Cardboard are up over 2% versus one year ago.
– Textile fabric prices were mostly unchanged in the fourth quarter, except Raw Cotton in price was up 3.2%. Meanwhile, year over year, most of Textile prices keep steady, while Raw Cotton and 100% Polyester Fabric are down 14.9% & 5.3% respectively versus one year ago.
CERAMIC AND GLASS RAW MATERIALS
-In Ceramic Raw Materials, the trend for the grades were mostly steady in Q4, with Soda Ash obviously dropped 10.8%, followed by Alumina and Glass Grade Sand in price were down 5.4% and 0.3% respectively. Year over year, Kaolin and Feldspar are up over 2%. Other prices are all down, Glass Grade Sand is slightly down 0.9% and Soda Ash is dropped 25% versus one year ago.
FUEL
Fuel prices in China were generally going up, with LPG , Diesel Oil prices were obviously up in the range of 43% ~ 48% in the fourth quarter. However, Petroleum price was unchanged. Similarly, year over year, the trend for the grades are increased in price, with Diesel Oil in price is largely up to 57.4%, followed by LPG price sharply increase 52.9%, while Petroleum is down over 15% versus one year ago.
OCEAN FREIGHT
The World Container Index was obviously up 21.8% in the fourth quarter. Year over year, the World Container Index is increase 2% versus one year ago. This is a huge change and a significant negative indicator for Asian manufacturing.
COST OF LABOR
All of the Asian labor rates were unchanged in Q4. Year over year, rates are up in most countries with Bangladesh rate is sharply up the most (over 50%) followed by Indonesia (up 9.4%), China and Vietnam are up 2.5% and 5% respectively.
CURRENCY EXCHANGE RATE
For the fourth quarter, the USD was slightly strength against the Bangladesh Taka, and weaker against China RMB, India Rupees, Taiwan New Dollars, Indonesian Rupiah , Thailand Baht and Vietnam Dong. Year over year, the biggest gains for the USD are against the Bangladesh Taka, followed by China RMB, and weaker against others.
CHINA TRADE (Data lags by one month)
– China Imports was slightly up 2.8% and Exports was up 1.47% in the fourth quarter. Year over year, China Imports is obviously increased 11.76% and Exports is up faintly 0.05% versus one year ago.
– The China Consumer Price Index (CPI) and China Producer Price Index (PPI) were all slightly up in the fourth quarter. Year over year, the China CPI is up 2.55% while the China PPI is down marginally versus one year ago.
PURCHASING MANAGERS INDEX (PMI)
USA PMI and Hong Kong PMI were both down slightly, while China PMI was up in the fourth quarter. Year over year, USA PMI is down over 13%, while China PMI and Hong Kong PMI are up 1.62% and 9.34% respectively versus one year ago.
CONTACT US FOR MORE INFORMATION
Thank you for taking the time to follow trends in Asia manufacturing. Source International has operational offices in Louisville, Kentucky, Xiamen, China and Saigon, Vietnam. Our passion is to partner with companies in supply management from Asia. We have a 26 year on-the-ground track record, a rigorous operating procedure, and a very well trained local staff. We welcome the opportunity to show you how we can add value to your supply chain in Asia and invite you to visit our offices to learn more about us.
Data for this report comes from the sources listed and while every attempt is made to be as comprehensive and accurate as possible, please consider that these are just general trends and you should not draw any specific conclusions from the data. We recommend that any information provided in this report be weighed against other sources and experts on the individual topics covered and\, accordingly, we make no specific claims nor assume any liability from the use of the data contained herein.
Posted by Joe Simon on | Comments Off on ASIA MANUFACTURING COST DRIVERS REPORT | Q3 2019
Tracking The Trends Which Drive Costs In Asian Manufacturing
Q3– 2019 (Jul, Aug, Sept)
The commodity price trends in the third quarter are mixed in Asia. Many grades of Plastics, Rubber, Paper, Textiles and Ceramics raw materials prices were mostly down in price. While some grades of Alum, Metals, Wood and Fuel prices were all up. Labor rates were steady in the lower wage countries. The trend for World Container Index was decreased. Only Steel prices were mixed. The US Dollar was up a little bit against most of the Asian currencies in Q3. China imports and exports saw slightly up in this quarter. The China CPI was up marginally, and the China PPI was slightly down. The PMI indexes saw slightly down in Q3, PMI China and PMI Hong Kong saw faintly up, while PMI USA decreased slightly. Below is a chart of the general trends and for all the details, please see the entire report.
Report Details
PLASTICS & RUBBER
– Most of General Purpose plastic prices were down in third quarter. Expect for the prices for PET (SE-3030) and PE (LD400/Injection) are steady. Balance of the general plastic prices was down on the average of 4.6%. Year over year, most of the general plastic prices are down, with PP (K8303) decreased marginally which up to 2%, other plastic prices are down over 12%. Only PVC (S700) is unchanged versus one year ago.
-The third quarter of engineering plastic prices were down, PC (L-1250Y) in price was down 3.7, followed by Nylon (PA6) and ABS both in price decreased 1.5%, while PU Foam was unchanged. Similarly, year over year, ABS down most in price which is over 18%, followed by PC (L-1250Y) down 8.4%, and PU Foam’s price is down faintly. While Nylon (PA66) and POM prices are increase slightly. Only Nylon (PA6) is steady versus one year ago.
– Most of the Rubber prices were down in Q3, BR9000 saw a little up which is over 7.8%. CR saw obviously down in price, which was over 8.9%. Latex, EPDM and SCR5 prices were all down over 5%. NBR price was steady. Year over year, expect for NBR price is unchanged, balance of rubber prices are down, with CR, EPDM and BR9000 prices are sharply down 13%, followed by Latex and SCR5 prices are down 4% and 0.9% respectively versus one year ago.
METALS
– For the third quarter of 2019, the prices for Carbon Steel were mixed. Hot Roll Steel Tube Cold Roll Steel Sheet prices were up 5.4% and 4.3% respectively, while Hot Roll Steel Sheet was down 3.2% in price and Steel Wire price was down 0.2%. Cold Roll Steel Tube and Pig Iron prices were steady. Year over year, all of carbon steels in price are down on the average 9.1% versus one year ago.
– In the Stainless Steel part, most of the grades of prices were up in the third quarter, with 304, 430 and 420 in price up on average of 4.2%, while 410 and 201 prices were down 2.5% and 6.5% respectively. Year over year, most of the Stainless Steel prices are down, with 201 and 410 prices sharply down over 13%, followed by 420 and 430 prices down slightly versus one year ago.
– All aluminum prices were up faintly in the third quarter. Year over year, Only 6061 in price is up 0.7%, the rest of grades are down on the average of 2.1% versus one year ago.
– In other Industrial Metals, the trend for most of grades was increasing in Q3, with Nickel in price was significantly up 36.6%, and the prices for Copper and Brass Rod were both up marginally. Only Zinc in price was down 9.2%. Similarly, year over year, Nickel price is significantly up 31.6%, and Brass Rod price is up slightly. While Zinc price is sharply down 16.6% and Copper price is down 6.9% versus one year ago.
WOOD, PAPER & TEXTILE
– Wood prices were slightly higher in Q3, except for Pine Softwood was down marginally in price, Beech Hardwood and MDF prices were up 0.3% and 1.5% respectively. Year over year, Beech Hardwood and Pine Softwood are up marginally, while MDF price is unchanged versus one year ago.
– Similarly, most grades prices of Paper Materials were down in the third quarter, expect for Art Paper in price is steady, the rest of grades prices were down on the average of 3.8%. Year over year, the trend for paper price is decreasing, with Corrugated Board and Art Paper both enormously down over 23%, Kraft paper and Gray Cardbord are up faintly. While Kraft paper in price is unchanged versus one year ago.
– Textile fabric prices saw a little change in the third quarter, with Raw Cotton price was obviously down 10.2% in price, and 100% Polyester Fabric price down 5.3%. Meanwhile, year over year, with Raw Cotton price is significantly down 22.4%, and 100% Polyester Fabric price is sharply down 14.5% versus one year ago.
CERAMIC AND GLASS RAW MATERIALS
-In Ceramic Raw Materials, the trend for the grades was down in Q3, with Alumina obviously dropped 18.9%, followed by Soda Ash in price was down 7.5%, and Quartz’s price was down marginally. Year over year, Alumina is down most which is over 22%, followed by Soda Ash is down 11.9%, Quartz, Glass material and Glaze prices are down on the average of 2.9%. While Kaolin and Feldspar prices are up 6.1% and 2% respectively versus one year ago.
FUEL
Fuel prices in China were generally going up, with LPG , Diesel Oil and Natural Gas prices were obviously up in the range of 9% ~15% in the third quarter. However, Petroleum price was unchanged. On the contrary, year over year, all Fuel prices are decreasing in price, with Diesel Oil in price is significantly down 30.5%, followed by LPG price sharply down 29%, the rest fuels are down in price between 8%~15% versus one year ago.
OCEAN FREIGHT
The World Container Index was faintly down 0.3% in the third quarter. Year over year, the World Container Index is sharply down 26% versus one year ago.
COST OF LABOR
All of the Asian labor rates were unchanged in Q3. Year over year, rates are up in most countries with Bangladesh rate is sharply up the most (over 50%) followed by Indonesia (up 9.4%), Vietnam and India are both up over 5%, and China is up marginally.
CURRENCY EXCHANGE RATE
For the third quarter, the USD was obviously strength against the Indonesian Rupiah, and slightly strength against China RMB, Bangladesh Taka, India Rupees, while slightly weaker against Taiwan New Dollars, Thailand Baht and Vietnam Dong. Year over year, the biggest gains for the USD are against the Indonesian Rupiah, followed by China RMB, and slightly strength against Bangladesh Taka, Taiwan New Dollars and India Rupees, while it’s slightly weaker against the Thailand Baht, Indonesia Rupiah and Vietnam Dong.
CHINA TRADE (Data lags by one month)
– China Imports was slightly up 3.6% and Exports was up 2.01% in the third quarter. Year over year, China Imports is obviously down 8.51% while Exports is down 3.79% versus one year ago.
– The China Consumer Price Index (CPI) was up marginally while the China Producer Price Index (PPI) was faintly down 0.4% in the third quarter. Year over year, the China PPI is down 4.63% while the China CPI is up marginally versus one year ago.
PURCHASING MANAGERS INDEX (PMI)
USA PMI and Hong Kong PMI were both up slightly, while China PMI was down in the third quarter. Year over year, China PMI and USA PMI are both down, with UPS PMI down most which is over 22% followed by China PMI down 1.97%, while Hong Kong PMI is up 5.98% versus one year ago.
CONTACT US FOR MORE INFORMATION
Thank you for taking the time to follow trends in Asia manufacturing. Source International has operational offices in Louisville, Kentucky & Xiamen, China. Our passion is to partner with companies in supply management from Asia. We have a 26 year on-the-ground track record, a rigorous operating procedure, and a very well trained local staff. We welcome the opportunity to show you how we can add value to your supply chain in Asia and invite you to visit our offices and website to learn more about us.
For additional details, please refer to the charts that follow or contact one of our Operations Specialists for more information. Thank you for your support.
Data for this report comes from the sources listed and while every attempt is made to be as comprehensive and accurate as possible, please consider that these are just general trends and you should not draw any specific conclusions from the data. We recommend that any information provided in this report be weighed against other sources and experts on the individual topics covered and\, accordingly, we make no specific claims nor assume any liability from the use of the data contained herein.
Posted by Joe Simon on | Comments Off on ASIA MANUFACTURING COST DRIVERS REPORT Q2– 2019 (Apr, May, Jun) Tracking The Trends Which Drive Costs In Asian Manufacturing
Executive Summary
The commodity price trends in the second quarter are down in Asia. Many grades of Plastics, Steel, Metals, Fuel, Textiles and Ceramics raw materials prices were mostly down in price. While some grades of Alum, Wood and paper prices were all up. Labor rates were steady in the lower wage countries. The trend for World Container Index was increase. Only Rubber prices were mixed. The US Dollar was up a little bit against most of the Asian currencies in Q2. China imports and exports saw slightly up in this quarter. The China CPI was steady, and the China PPI was down marginally. The PMI indexes saw slightly down in Q2, PMI China was steady, while PMI Hong Kong and PMI USA saw faintly decreasing. Below is a chart of the general trends and for all the details, please see the entire report.
Report Details
PLASTICS & RUBBER
– Most of General Purpose plastic prices were down in second quarter. PP(Food Grade), PE (LD400/Injection) and PP (K8303) were all down over 3%, PVC (S700) and HIPS (PH88) both down marginally, while others were unchanged. Year over year, expect for HDPE (HHMTR210) up 3.8%, and PE (LD400/Injection) is steady, balance of the general plastic prices are down over 6% versus one year ago.
– Similarly, the second quarter of engineering plastic prices were down, except for Nylon (PA6) up 2.6%, ABS, PC (L-1250Y) and PU Foam were all down slightly. POM and Nylon (PA66) are both steady. Year over year, ABS in price is obviously down 17.4%, followed by PC (L-1250Y) down 4.8% and PU Foam is faintly down 2.1%, while the other prices are up on the average of 5.8% versus one year ago.
– Most of the Rubber prices were down in Q2, SCR5 saw a little up which is over 2%. EPDM saw obviously down in price, which was over 8%. Latex, CR prices were all down over 2%, BR9000 was down marginally. NBR price was steady. Year over year, SCR5, Latex and NBR prices slightly up which are over 2%, while EPFM in price is down 8.3%, followed by CR down 3% and BR9000 down 2.6% versus one year ago.
METALS
– For the second quarter of 2019, most of the prices for Carbon Steel were down. Hot Roll Steel Tube Cold Roll Steel Sheet and Cold Roll Steel Tube in price were down 6.1%, 5.9% and 2.3% respectively. While Hot Roll Steel Sheet and Steel Wire were both up over 2%. Pig Iron is unchanged. Year over year, expect for Steel Wire and Pig Iron are steady. Other carbon steels in price are down on the average 8.3% versus one year ago.
– In the Stainless Steel part, most of the grades of prices were down in the second quarter, with 410, 430 and 304 in price down on average of 3.5%, while 402 and 201 in price were up 3.4% and 0.6% respectively. Year over year, all the Stainless Steel prices are down over 4% versus one year ago.
– All aluminum prices were up faintly in the second quarter. Year over year, Only 6061 in price is up 2.5%, the rest of grades are down on the average of 0.9% versus one year ago.
– In Other Industrial Metals, all grades trend was decreasing in Q2, with Copper and Nickel in price were both down over 7%, Zinc and Brass Rod prices were down 5.3% and 3.9% respectively. Year over year, Zinc’s price is sharply down 18.6%, followed Nickel price up 15.2%, Copper price down 9.6% and Brass Rod price is down marginally versus one year ago.
WOOD, PAPER & TEXTILES
– Wood prices were slightly higher in Q2, except for Beech Hardwood was steady in price, Pine Softwood and MDF prices were up 0.5% and 1.6% respectively. Year over year, Beech Hardwood and Pine Softwood are up marginally, while MDF price is down 1.5% versus one year ago.
– Similarly, most grades prices of Paper Materials were up in the second quarter, with Kraft paper was sharply up 24.6%, followed Gray Cardbord was up 15.2% and White Cardboard was up 12.2% in price. While Corrugated Board and Art paper prices were down 14.7% and 7.4% respectively. Year over year, the trend for paper price is decreasing, with Corrugated Board and Art Paper both enormously down over 23%, Kraft paper is down marginally. Kraft paper and Gray Cardbord are up faintly versus one year ago.
– Textile fabric prices saw a little change in the second quarter, with Raw Cotton price was down 6.7% in price. While the rest grades prices were steady. Year over year, the grade in prices are mixed, with Raw Cotton price is sharply up 13.5%, but 100% Polyester Fabric price is up 5%. The rest of Textiles prices are unchanged versus one year ago.
CERAMIC AND GLASS RAW MATERIALS
-In Ceramic Raw Materials, the grades in price were up in Q2, with Alumina was obviously down 8.9%, Kaolin, Feldspar and Soda Ash were all up slightly. Year over year, Alumina is up moat which is over 17%, Kaolin’s price is up 2.3%. While other Ceramic and Glass material prices are up on the average of 4.7% versus one year ago.
FUEL
Fuel prices in China were generally going down, with LPG , Diesel Oil and Natural Gas prices were obviously down in the range of 2% ~15% in the second quarter. However, Petroleum price was unchanged. Meanwhile, year over year, all Fuel prices are decreasing in price, with Diesel Oil in price is significantly down 20.4%, the rest fuels are down slightly in price between 8%~15% versus one year ago.
OCEAN FREIGHT
The World Container Index was faintly up 0.4% in the second quarter. To the contrary, year over year, the World Container Index is slightly up 2% versus one year ago.
COST OF LABOR
All of the Asian labor rates were unchanged in Q2.Year over year, rates are up in most countries with Bangladesh rate is sharply up the most (over 50%) followed by Indonesia (up 9.4%), Vietnam and India both up over 5%, and China is up marginally.
CURRENCY EXCHANGE RATE
For the second quarter, the USD was slightly strength against the Vietnam Dong, India Rupees, China RMB and Taiwan New Dollars, while slightly weaker against Thailand Baht Bangladesh Taka and Indonesian Rupiah. Year over year, the biggest gains for the USD are against the China RMB, slightly strength against India Rupees, Bangladesh Taka, Taiwan New Dollars, and Vietnam Dong while its slightly weaker against the Thai Baht and Indonesia Rupiah.
CHINA TRADE (Data lags by one month)
– China Imports was slightly up 3.73% and Exports was obviously up7.65% in the second quarter. Year over year, China Imports is slightly down 1.66% while Exports are up 1.34% versus one year ago.
– The China Consumer Price Index (CPI) was unchanged while the China Producer Price Index (PPI) was faintly down 0.6% in the second quarter. Year over year, the China PPI is down 4.49% while the China CPI is up marginally versus one year ago.
PURCHASING MANAGERS INDEX (PMI)
USA PMI and Hong Kong PMI were both down slightly. Only China PMI was unchanged in the second quarter. Year over year, China PMI, China PMI and USA PMI are both down slightly, with UPS PMI down most which is over 14% followed by China PMI down 4.08%, while Hong Kong PMI is up 1.63% versus one year ago.
CONTACT US FOR MORE INFORMATION
Thank you for taking the time to follow trends in Asia manufacturing. Source International has operational offices in Louisville, Kentucky & Xiamen, China. Our passion is to partner with companies in supply management from Asia. We have a 26 year on-the-ground track record, a rigorous operating procedure, and a very well trained local staff. We welcome the opportunity to show you how we can add value to your supply chain in Asia and invite you to visit our offices and website to learn more about us.
For additional details, please refer to the charts that follow or contact one of our Operations Specialists for more information. Thank you for your support.
Data for this report comes from the sources listed and while every attempt is made to be as comprehensive and accurate as possible, please consider that these are just general trends and you should not draw any specific conclusions from the data. We recommend that any information provided in this report be weighed against other sources and experts on the individual topics covered and\, accordingly, we make no specific claims nor assume any liability from the use of the data contained herein.
Posted by Joe Simon on | Comments Off on ASIA MANUFACTURING COST DRIVERS REPORT Q4
Executive Summary
The commodity price trends in the fourth quarter are mostly down in Asia. Many grades of Plastics, Rubber, Steel, Alum, Metals, Paper, Textiles raw materials and Fuel prices were mostly down in price while some grades of Wood, Freight went up in price. Labor rates were steady in the lower wage countries, and Ceramics price was mixed. The US Dollar was down a little bit against most of the Asian currencies in Q4. China imports and exports saw sharply down in this quarter. The China PPI and the China CPI were both down slightly. The PMI Hong Kong indexes saw a slightly improvement in Q4 while PMI China and PMI USA saw marginally down. Below is a chart of the general trends and for all the details, please see the entire report.
Report Details
PLASTICS & RUBBER
– Except for PET (SE-3030) was unchanged, the rest of General Purpose plastic resin prices were down in the fourth quarter, PP (K8303), HIPS (PH88), PP (Food Grade), PS (GPPS/688B) and PE (LD400/Injection) were down on the average of 10.8%, the others down in price marginally. Year over year, the prices is mixed. PE (LD400/Injection) and HIPS (PH88) prices are down 10.1% and 8.2% respectively, and PP (Food Grade) and PS (GPPS/688B) are down slightly, while HDPE (HHMTR210), PP (K8303) and PVC (S700) are up mildly in price versus one year ago.
– Engineering plastic prices were all down in the fourth quarter, ABS price was obviously down 11.9% and the balance plastic prices were down marginally. Year over year, ABS in price is down the most at 18.5% followed by PU Foam down 2.6%, while Nylon (PA66) and POM prices are up 6.0% and 9.6% respectively, and the others are only up marginally in price versus one year ago.
– Most of the Rubber prices were down in Q4, BR saw a huge down in price, which was over 19% and Natural, Latex, SCR5 and CR prices were all down over 2%. NBR and EPDM prices were steady. Year over year, SCR5 and Latex prices are down largely which are over 12% and BR down slightly, while EPFM up 9.1% , followed by CR up 6.3% and NBR up marginally versus one year ago.
METALS
– For the fourth quarter of 2018, all the prices for Carbon Steel were down, with Hot Roll Steel Tube was down the most which was over 19%, followed Pig Iron was down 12%, and others were down on the average of 9.7%. Similarly, year over year, the trend is all down with Hot Roll Steel Tube down the most at 21.1%. Others are down on the average of 10.6% versus one year ago.
– In the Stainless Steel part, all grades of prices were down in the fourth quarter, with down on average about 3.9%. Similarly, year over year, the trend is down, with 430 is down the most that over 14%, and other grades of stainless steel is down in price on average about 5.5% versus one year ago.
– All aluminum grades were down faintly in price in the fourth quarter. Year over year, all prices are down in price, with 6061 is down the most which is over by 12% followed A00 and 3003 down 6.8% and 4.6% respectively, and 1060 price is down marginally.
– In Other Industrial Metals, all grades trend was down in Q4. Nickel’s price was down by 14.8%, followed Copper down 4.1% in price and the rest of metals were down a little. Year over year, most of metals prices are down, with Nickel down most (close to 14%) followed by Nickel down 6.1%, Copper and Brass Rod are both down 3.1% versus one year ago.
WOOD, PAPER & TEXTILES
– Wood prices were slightly higher in Q4 except MDF was steady in price. Year over year, MDF’s price increase over 6% and Beech Hardwood over 3% respectively, and the Pine Softwood is up marginally.
– While all grades prices of Paper Materials were down in the fourth quarter, with Corrugated Board price was sharply down 16.1%, and others were down slightly. Meanwhile, year over year, all grades of paper in prices are decreasing, with Art Paper down over 11% and others prices down on average of 5.9% versus one year ago.
– Textile fabric prices saw little change in the fourth quarter with 100% Polyester Fabric and Raw Cotton down 9.7% and 5.9% respectively, while the rest were steady. Year over year, the grade in prices are mixed, with 100% Polyester Fabric up over 11.1%, but Raw Cotton is down in price at 2.5% while the rest are unchanged versus one year ago.
CERAMIC AND GLASS RAW MATERIALS
-In Ceramic Raw Materials, the grades in price were mixed in Q4. Except for Feldspar was unchanged, and Alumina and Quartz were down 10.8% and 2.6% respectively, while other grades in price were up slightly. Meanwhile, year over year, Soda Ash, Quartz Glass Grade Sand and Glaze are all down marginally while Kaolin and Feldspar are steady. Only Alumina is up 4.2% versus one year ago.
FUEL
Fuel prices in China were generally going down with LPG , Natural Gas and Diesel Oil were significant down in the range of 21% ~35% in the fourth quarter, and year over year, except for Petroleum is unchanged, Natural Gas is slightly down 7.4% and the rest fuels are down significantly in price between 26%~31% versus one year ago.
OCEAN FREIGHT
The World Container Index was slightly up 0.88% in the fourth quarter. Year over year, the World Container Index is sharply up 30% versus one year ago.
COST OF LABOR
Most of the Asian labor rates saw no change, except for India labor rates saw slightly up in the fourth quarter. Year over year, rates are up in most countries with Indonesia up the most (over 7%) followed by Thailand (up 6.56%), Vietnam (up 6.13%), China (up 5.22%) while India labor rate is down 13.45%. Bangladesh is unchanged.
CURRENCY EXCHANGE RATE
For the fourth quarter, the USD was slightly weaker against the Bangladesh Taka, Vietnam Dong, Thailand Baht, Chinese Yuan, Indonesian Rupiah while slightly strength against Taiwan New Dollars, and India Rupees. Year over year, the biggest gains for the USD are against the India Rupees and followed by China RMB, Taiwan New Dollars, Indonesia Rupiah and Vietnam Dong and while its slightly weaker against the Thai Baht.
CHINA TRADE (Data lags by one month)
– China Imports was obviously down 15.85% and Exports was slightly down by 2.43% in the latest fourth months. Similarly, year over year, China Imports and Exports are down by almost 7.34% and 4.57% respectively.
– The China Producer Price Index (PPI) and the China Consumer Price Index (CPI) were both slightly down 3% and 0.59% respectively in the fourth quarter. Year over year, the China PPI is down 3.81% while the China CPI is up marginally versus one year ago.
PURCHASING MANAGERS INDEX (PMI)
USA and China PMI were both down slightly. Only Hong Kong PMI was slight down 0.21% in the fourth quarter. Year over year, China PMI and Hong Kong PMI is down slightly while USA PMI is unchanged versus one year ago.
CONTACT US FOR MORE INFORMATION
Thank you for taking the time to follow trends in Asia manufacturing. Source International has operational offices in Louisville, Kentucky & Xiamen, China. Our passion is to partner with companies in supply management from Asia. We have a 25 year on-the-ground track record, a rigorous operating procedure, and a very well trained local staff. We welcome the opportunity to show you how we can add value to your supply chain in Asia and invite you to visit our offices and website to learn more about us.
For additional details, please refer to the charts that follow or contact one of our Operations Specialists for more information. Thank you for your support.
Data for this report comes from the sources listed and while every attempt is made to be as comprehensive and accurate as possible, please consider that these are just general trends and you should not draw any specific conclusions from the data. We recommend that any information provided in this report be weighed against other sources and experts on the individual topics covered and\, accordingly, we make no specific claims nor assume any liability from the use of the data contained herein.
Posted by Joe Simon on | Comments Off on ASIA MANUFACTURING COST DRIVERS REPORT Q3
The commodity price trends in the third quarter in Asia are mostly up. Many grades of Plastics, Rubber, Steel, Alum, Wood and Paper raw materials rose in price while some grades of Metals, Textiles and Ceramics went down in price. Petroleum and fuel prices were up in this quarter and labor rates were steady in the lower wage countries. The US Dollar rose moderately against most of the Asian currencies in Q3. China imports and exports saw up in the quarter. The China PPI was down slightly while the China CPI was up slightly. The PMI USA and Hong Kong indexes saw a slightly improvement in Q3 while PMI China saw a little marginally down. Below is a chart of the cost driver trends in 2018-Q3 and for all the details, please see the entire report.
ASIA MANUFACTURING COST DRIVERS REPORT DETAILS
PLASTICS & RUBBER
– All General Purpose plastic resin prices were up in the third quarter, PP(K8303) and Food Grade are up significantly (on average about 8.9%) and the others only up in price marginally. Year over year, PVC and PE prices are down 7.2% and 4.3% respectively. But most plastic prices remain up in price versus one year ago. PP (K8303) is up the most (close to 22%), followed by PP up 13.7% and PS up 9.6% while PET price is unchanged.
– Engineering plastic prices were more mixed with Nylon and Nylon (PA6) and POM prices up by 6.6%, 5.4% and 4.1% respectively, while ABS and PU Foam prices were down slightly. Year over year, ABS up in price the most at 21.4% followed by Nylon up over 11% and the others only up in prices marginally, while ABS and PU Foam were down marginally in price versus one year ago.
– Most of the Rubber prices were up in Q3, BR saw a huge up in price, up over 22% and Latex, SCR5 and CR prices were all up over 5%. NBR is the only one which down marginally in price. EPDM price is unchanged. Year over year, CR and EPDM prices up sharply which are over 19% and BR and NBR up slightly, while Latex and SCR5 down marginally versus one year ago.
METALS
– For the third quarter of 2018, most of the prices for Carbon Steel were up, with Steel Wire is up most which was over 12% followed Pig Iron was up 8.5%, others were up marginally. Only Hot Roll Steel Sheet in price was down a little. Year over year, the trend is all up with Cold Roll Steel Tube and Pig Iron up over14% and others up slightly.
– In the Stainless Steel part, 201, 410 and 304 prices were up on average about 3% while 420 and 430 grade down a little in the third quarter. Year over year, the trend is down with most grades of stainless steel down in price on average about 9%. Except for 304 price is up 3.7%.
– All aluminum grades rose faintly in price in the third quarter. Year over year, all prices were down in price, with 6061 is down the most which is over by 27% followed 3003 and A00 down 13.6% and 11.1% respectively, and 1060 price is down marginally.
– In Other Industrial Metals, all grades trend was down in Q3. Nickel’s price was down by 11%, followed Zinc down 7.2% in price and the rest of metals were down a little. Year over year, most of metals prices are up, with Nickel is up most (close to 14%) and Copper and Brass Rod are both up 2.6% while Zinc price is down 12.8% versus one year ago.
WOOD, PAPER & TEXTILES
– Wood prices inched slightly higher in Q3 except Pine and MDF is steady in price. Year over year, MDF’s price increase over 13% and the others only up marginally.
– Meanwhile most grades prices of Paper Materials were no change except for Corrugated Board price down 4.1% in the third quarter. Year over year, most of the paper prices are decreasing, with Corrugated Board down over 16% and others prices down a little. Only Art Paper is steady.
– Textile fabric prices saw little change in the third quarter with Raw Cotton down slightly and the rest were unchanged. Year over year, the grade in prices are mixed, with Raw Cotton and Polyester Fabric up in price t at 2.4% and 0.3% respectively while the 100% Polyester Fabric and 100% Cotton Fabric are down marginally.
CERAMIC AND GLASS RAW MATERIALS
-In Ceramic Raw Materials, only Alumina price was up over 23%, while in Feldspar, Soda Ash and Kaolin were down in price on average 4.6% and rest were down marginally. Year over year, Feldspar, Kaolin and Quartz are all up marginally while rest were down, with Soda Ash is down in price the most by 16%, followed by Alumina down 5.9%, Glass Grade Sand and Glaze were down slightly versus one year ago.
FUEL
Fuel prices in China were generally going up with LPG and Diesel Oil were significant in the range of 25% ~32% in the third quarter, and year over year, except for Petroleum is unchanged, the rest fuels are up significantly in price between 21%~29% one year ago.
OCEAN FREIGHT
The World Container Index was up 13.7% in the third quarter. Year over year, the World Container Index was sharply up 31% versus one year ago.
COST OF LABOR
Asian labor rates saw no change in the third quarter. Year over year, rates are up in most countries with Indonesia up the most (over 7%) followed by Thailand (up 6.6%), Vietnam (up 6.1%), China (up 5.2%) while India labor rate down 13.5%. Bangladesh was unchanged.
CURRENCY EXCHANGE RATE
For the third quarter, the USD is obviously strengthened slightly against the Thailand Baht, Chinese Yuan, Taiwan New Dollars, India Rupees, Indonesian Rupiah, Vietnam Dong and Bangladesh Taka. Year over year, the biggest gains for the USD are against the Indonesian Rupiah and India Rupees China RMB, Thailand Baht, Vietnam Dong and Indonesia Rupiah while its slightly weaker against the China RMB and Thai Baht.
CHINA TRADE (Data lags by one month)
– China Imports and Exports were both up by 11.36% & 4.61% respectively in the latest third months. Similarly, year over year, China Imports and Exports are up obviously by almost 15%.
– The China Producer Price Index (PPI) gone down 1.1% in the third quarter while the China Consumer Price Index (CPI) rose slightly. Year over year, the China PPI is down 3% while the China CPI is up slightly versus one year ago.
PURCHASING MANAGERS INDEX (PMI)
USA and Hong Kong PMI were both up slightly. Only China PMI was down 0.7% in the third quarter. Year over year, China PMI and Hong Kong PMI is down slightly while USA PMI is up slightly versus one year ago.
Thank you for taking the time to follow trends in Asia manufacturing. Source International has operational offices in Louisville, Kentucky & Xiamen, China. Our passion is to partner with companies in supply management from Asia. We have a 25 year on-the-ground track record, a rigorous operating procedure, and a very well trained local staff. We welcome the opportunity to show you how we can add value to your supply chain in Asia and invite you to visit our offices and website to learn more about us.
For additional details, please refer to the charts that follow or contact one of our Operations Specialists for more information. Thank you for your support.
Visit our Linked-In Page
Data for this report comes from the sources listed and while every attempt is made to be as comprehensive and accurate as possible, please consider that these are just general trends and you should not draw any specific conclusions from the data. We recommend that any information provided in this report be weighed against other sources and experts on the individual topics covered and\, accordingly, we make no specific claims nor assume any liability from the use of the data contained herein.
Posted by Joe Simon on | Comments Off on ASIA MANUFACTURING COST DRIVER REPORT, 2018 Q2
ASIA MANUFACTURING COST DRIVER REPORT, 2018 Q2
The ASIA MANUFACTURING COST of commodity price trends in the second quarter are mostly up across the board with a few rare exceptions. Most grades of plastics, industrial metals, paper, ceramic and glass raw materials all rose in price while only some grades of rubber and alumina for ceramic production were going down in price. Wood prices meanwhile remained mostly flat and Textiles prices were mixed. Petroleum and fuel prices were up in this quarter and labor rates inched up in the lower wage countries. The US Dollar rose a little bit against most of the Asian currencies in Q2. China exports saw up in the quarter while China imports were down. The China PPI was up slightly while the China CPI was down slightly. The PMI USA indexes saw steady improvement in Q2 and PMI China saw maintained while PMI Hong Kong was down significantly. Below is a chart of the general trends and for all the details, please see the entire report.
DETAILS
PLASTICS & RUBBER
The cost of the General Purpose plastic resin prices were up marginally in the second quarter with PP, PVC, PS, Food Grade PP, HIPS and HDPE and only PE (LD400) down in price by 2.0%. The PET remained steady. Year over year, the trends for most material were up. PP is up the most (close to 20.00%) followed by PP GP, PS, PVC and HIPS are all up over 8%, and HDPE and PE both up marginally and the PET is steady in prices versus one year ago.
ENGINEERING PLASTICS
Most of the Engineering plastic resin prices were up in second quarter with PC , POM and ABS marginally and only Nylon down in price by 2.6% , the others remains steady. Year over year, PP is up a whopping 28.9% followed by PC up over 10% and Nylon(PA66) and ABS relatively increase a little, while PU Foam is down by 4.5%.Nylon (PA6)is only grade which remains unchanged in price versus one year ago.
RUBBER
Most of the Rubber prices were down in Q2, Latex and CR are both down marginally and only NBR is up by 6.00%, while BR and EPDM are steady. Year over year, CR is up most (over 21%) followed by EPDM is up over 17% and others are all down with Latex and Nature Rubber down over 19% in price versus one year ago.
CARBON STEEL
– For the second quarter of 2018, most of Carbon Steels were up in price with Steel Wire up by 11.5% and the others up marginally. Hot Roll Sheet Tube is exception with a slightly decrease by 2.7% and Cold Roll Steel Tube and Pig Iron is steady. Year over year, the trend is all grades of Carbon Steel go up in price with Pig Iron and Cold Roll Steel Tube up over 23% following by Hot Roll Steel Sheet and Hot Roll Steel Tube up by 18.9% & 17.6%, and the rest are go up all over 8% in price.
STAINLESS STEEL
In Stainless Steel, most grades were down in price between 2% – 7% with #403 down the most while #304É up a little in the second quarter. Year over year, the trend remains up with most grades of stainless steel up in price on average about 9% versus one year ago except for #410 down by 3.3%.
ALUMINUM
Most aluminum grades rose in price in the second quarter while Aluminum 6061 were down close to 6%, and year over year, Aluminum 6061 go down in price by almost 22% and Aluminum 3303 down by 4.9%, while A00 and Aluminum 1060 are slightly increased in price.
INDUSTRIAL METALS
In Other Industrial Metals, only Zinc price was down in Q2 while Nickel was up most (close to 22%) and the rest of metals were up marginally. Year over year, all grades of the prices are up especially Nickel is surged by 54.6% in price versus one year ago.
WOOD
Wood prices are remaining steady in Q2. Year over year, MDF’s price is up over 15% and the others only upmarginally.
PAPER
Most of Paper Materials were up in price in the second quarter with Corrugated Board up in price by 7.8% followed by Kraft Paper, White Cardboard and Gray Cardboard are up marginally and only ArtP aper decreased by 2%. Year-over-year,Corrugated Board and Kraft Paper prices are still higher up by 29.3% and 18.7% respectively. The others are up marginally except for Art Paper is unchanged in price versus one year ago.
TEXTILES
Textile fabric prices saw mixed in the second quarter with 100% Polyester fabric is down over 5% while Raw Cotton is up over 5% and the rest were unchanged. Year over year, all prices is up slightly which 100% Polyester Fabric is up by 8.1% and Raw Cotton andNon-woven PP Fabric are both up over 4% in price versus one yearago.
CERAMIC AND GLASS RAW MATERIALS
In Ceramic Raw Materials, only Alumina’s price was down slightly, while in Glass Raw Materials Soda Ash was up in price over 15% and Glass Sand remain steady. Year over year, the trend of all price is up and the Soda Ash is up most (close to 26%) followed by Feldspar and Kaolin is up on average 14% and the rest up marginally versus one year ago.
FUEL
Fuel prices in China were generally going up in the range of 13% except for China Petroleum is remain steady in the second quarter, and year over year, most of fuels are up significantly high which is up on average 35% versus one year ago except for China Petroleum remained steady. Fuel is an important part of asia manufacturing cost.
OCEAN FREIGHT
Ocean freight rates went up sharply in Q2. Year over year, the average composite index of the WCI, is US $1,375/40ft container, which is $157 lower than the five-year average of $1,532/40ft container all adding to the Asia manufacturing cost.
COST OF LABOR
Most of Asian labor rates saw unchanged while only China labor is up by 5.2% in the second quarter adding to Asia manufacturing costs. Year over year, rates are up in most countries with Indonesia up the most (over 7%) followed by Vietnam, Thailand and China are both up over 5% while Bangladesh saw no change. Cost of labor in India is down significant by 13.5% versus one year ago.
CURRENCY EXCHANGE RATE
For the second quarter, the USD strengthened slightly against the Chinese Yuan, Thai Baht, Bangladesh Taka, India Rupees, Indonesia Rupiah, Taiwan New Dollars and Vietnamese Dong with the Thai Baht, Chinese Yuan, India Rupees and Taiwan New Dollars stronger by over 5%. Year over year, the biggest gains for the USD are against the Indonesia Rupiah and India Rupees while its slightly weaker against the Chinese Yuan and Thai Baht adding to the overall Asia manufacturing cost.
CHINA TRADE (Data lags by one month)
China Imports was decreased by 7.31% while Exports was up by 1.83% in the latest three months. Year over year, China Exports are up by 2% and China Imports are down by over8%. The China Producer Price Index (PPI) is up slightly in the second quarter while the China Consumer Price Index (CPI) down slightly. Year over year, the China PPI is decreased slightly while the China CPI is up slightly versus one yearago.
PURCHASING MANAGERS INDEX (PMI)
Hong Kong PMI is down by over 8% and USA PMI is up slightly. Only China PMI is unchanged in the second quarter. Year over year, China PMI and Hong Kong PMI is down slightly with HK down by over 5% and USA PMI is up slightly versus one year ago.
Thank you for taking the time to follow trends in Asia manufacturing cost drivers. Source International has operational offices in Louisville, Kentucky & Xiamen, China. Our passion is to partner with companies in supply management from Asia. We have a 30 year on-the-ground track record, a rigorous operating procedure, and a very well trained local staff. We welcome the opportunity to show you how we can add value to your supply chain in Asia and invite you to visit our offices and website to learn more about us. Our Asia manufacturing cost driver report is one example how we can add value and make your supply chain in Asia run more efficiently and consistently.
For additional details, please contact one of our Operations Specialists about Asia manufacturing cost. If you have any suggestions about additions or changes to this report, we’d love your feedback. Thank you for your support.
Data for this report comes from the sources listed and while every attempt is made to be as comprehensive and accurate as possible, please consider that these are just general trends and you should not draw any specific conclusions from the data. We recommend that any information provided in this report be weighed against other sources and experts on the individual topics covered and\, accordingly, we make no specific claims nor assume any liability from the use of the data contained herein.
Posted by Joe Simon on | Comments Off on ASIA MANUFACTURING COST DRIVER REPORT-2018 Q1
ASIA MANUFACTURING COST DRIVER REPORT-2018 Q1
In the first quarter, there was a clear commodity price trends with most of raw materials in Asia going down in price. Many grades of plastics, steel, aluminum, paper, ceramic raw materials and other industrial metals went down in price while rubber and wood mostly rose in price. Textiles prices meanwhile remained mostly flat. Petroleum and fuel prices backed off their sharp increases and labor rates up in the lower wage counties. The US Dollar lost a little bit of ground against some of the Asian currencies in Q1. China Imports and Exports both saw significant decreases in the quarter and the China CPI was up slightly while the China PPI was down. Furthermore, PMI index remaining above 50 and signaling an expanding economy. Below is a chart of the general trends and for all the details, please see the entire report.
PLASTICS & RUBBER
Most of the General Purpose plastic resin prices were down in the first quarter with PE, PP, PVC, PS, Food Grade PP and HDPE down marginally and only EVA up in price by 1.5%. The others remained steady. Year over year, most plastic prices remain down in price versus one year ago. PS is down the most (close to 10%) followed by PE and PP which are both go down in price by over 6%. PP is only GP resin which is up in price by 2.8% versus one year ago.
Engineering plastic resin prices were mixed in Q1 with ABS prices drop the most by 7.5% and PC and PU Foam down slightly, while the others were all up slowly. Year over year, POM is up a whopping 30% followed by PC up over 11% and ABS relatively increase a little, while PU Foam, PA6 and Nylon show a decreasing tendency versus one year ago.
In the Rubber category, prices were mixed in Q1. SCR5 and Latex finally saw a drop in price, down almost 13 %, while Silicon Rubber and EPDM were up in price by 10% and 9% respectively following by CR increase by 6%. NBR was the only one remained unchanged. Year over year, except for CR shoot up in price by 30%, EPDM is up by 5.9%. Polybutadiene Rubber, SCR5 and Latex are all up on average 30% and NBR by 10.7% versus one year ago.
METALS
For the first quarter of 2017, all grades of Carbon Steel were down in price with Steel Wire and Steel Rib were down over 15% and the others decrease marginally. Year over year, the trend is most grades of Carbon Steel go up in price with Hot Rolled Steel Plate up over 23% following by Hot Roll Steel Sheet and Tinplate up by 15% & 9.8%, and the rest are go up marginally. Steel Wire is exception with a slightly decrease in price.
In addition, all grades of Stainless Steel still continued their down in price in the first quarter between 0.6% – 5.8% with 410 grade down the most. Year over year, the trend is mixed with 201 grade and 410 grade are go down in price by 11.5% and 6.3%, while the rest are go up on average 4.8% versus one year ago.
Moreover, all aluminum grades drop in price 3%-5.5% in the first quarter. And year over year, Aluminum 6061 go down in price by almost 17% and Aluminum down by 6.3%, while A00 and Aluminum 1060 are slightly higher in price.
And, in Other Industrial Metals, only Nickel’s price was up in Q1 while the rest of metals were down in price. Copper increased by 9.8% and Brass Tube decline 5%. Year over year, all the metals prices are increase with Zinc up sharply by over 31% and Nickel up over 16% versus one year ago.
WOOD, PAPER & TEXTILES
MDF increase by 9.5% in price and Beech Hardwood slightly higher in Q1 and the rest had no changed. Year over year all the prices are go up with MDF rise the most by over 24% and the others up slightly.
At the same time, Corrugated Board continued rise while the others saw a little change in the first quarter, all were relief on average 5.4%. Year over year, all paper prices remain higher, with Corrugated Board remaining up by almost 21% in price followed by Art Paper and Kraft rise by 15.5% and 14.8% respectively. Gray and White Cardboard only go up marginally versus one year ago.
Most of Textile fabric prices were remained unchanged the first quarter. Except Polyester Fabric went up and Cotton went down slightly. Year over year, most prices are higher, with Polyester and PVC Leather up in price the most at 14% and 6.7% respectively and the rest up more modestly versus one year ago.
CERAMIC AND GLASS RAW MATERIALS
In Ceramic Raw Materials, Alumina prices down by 1.75% in the first quarter and Quartz, Kaolin and Feldspar remained unchanged, while in Glass Raw Materials Soda Ash was down in price sharply over 17% and Glass Sand marginally. Year over year, Feldspar is up in price by over 33%, followed by Kaolin up 10%, Alumina up 6.5% and Quartz up 5.3%, while Glass Grade Sand is lower by 21% and Soda Ash and Glaze both keep in price steady versus one year ago.
FUEL
Fuel prices in China were decline generally by 10%-24.7% in the first quarter and year over year, China Petroleum, LPG Gas and Natural Gas are decrease on average 10%. Furthermore, China Diesel Oil increase by almost 12% and China Industrial Electric has no change versus one year ago.
OCEAN FREIGHT
Ocean freight rates down sharply in Q1 with Shanghai/ Ningbo/Xiamen/Yantian to Chicago down over 30% on average and to Long Beach down over 49%. Year over year, Shanghai/ Ningbo/Xiamen/Yantian to Chicago are down by 29% on average and to Long Beach down over 55%.
COST OF LABOR
Asian labor rates saw increase trend in the first quarter except for China and Bangladesh remained unchanged. And for Thailand, Indonesia and Vietnam which jumped by 15%, 7.5& and 6% respectively. Year over year, rates are up in most countries with Thailand up the most (over 15%) followed by Indonesia (up 7.5%), Vietnam (up 6%) and China (5%) while Bangladesh saw no sign to change.
CURRENCY EXCHANGE RATE
For the first quarter, the USD strengthened slightly against the India Rupees, Indonesia Rupiah, Vietnam Dong and Bangladeshi Taka and weakened slightly against the China Yuan, Thai Baht and NT Dollars. Year over year, the biggest gains for the USD are against the Bangladesh Taka, Indonesia Rupiah, India Rupees and Vietnam Dong while its weaker against the Thai Baht, China Yuan and NT Dollar.
CHINA TRADE (Data lags by one month)
China Imports and Exports were both down significantly in the latest three months owing to the Lunar New Year holiday, down by 23.5% & 14.4% respectively. Year over year, China Exports are shoot up by almost 43% and China Imports are up by over 6.6% from year ago levels.
US Imports and Exports were both up slightly compared to last month.
Vietnam and Bangladesh Imports and Exports were both increased significantly with Vietnam Exports rose over 38% and Imports up over 35.4%, and Indonesia Exports up over 18% and Imports up by 20%. On the contrary, Indian and Indonesian Exports and Imports were all down compared to last month.
The China Producer Price Index (PPI) decrease by 2% in the first quarter while the China Consumer Price Index (CPI) rose by 1.2%. Year over year, the China PPI is down 3.8 % while the China CPI is up by over 2% versus one year ago.
PURCHASING MANAGERS INDEX (PMI)
PMI Indexes saw little change in the first quarter with Caixin China PMI Index has been climbing steadily throughout the quarter while China Federation of Logistics & Purchasing shows the higher index and USA PMI Index remained stable. But all were above 50 in Q1. Year-on-year, CFLP PMI Index is little lower. On the contrary, Caixin China PMI index and USA PMI show upward trends indicating growth and an expanding economy.
Thank you for taking the time to follow trends in Asia manufacturing. Source International has operational offices in Louisville, Kentucky & Xiamen, China. Our passion is to partner with companies in supply management from Asia. We have a 25 year on-the-ground track record, a rigorous operating procedure, and a very well trained local staff. We welcome the opportunity to show you how we can add value to your supply chain in Asia and invite you to visit our offices and website to learn more about us.
For additional details, please refer to the charts that follow or contact one of our Operations Specialists for more information. Thank you for your support.
Data for this report comes from the sources listed and while every attempt is made to be as comprehensive and accurate as possible, please consider that these are just general trends and you should not draw any specific conclusions from the data. We recommend that any information provided in this report be weighed against other sources and experts on the individual topics covered and\, accordingly, we make no specific claims nor assume any liability from the use of the data contained herein.
Posted by Joe Simon on | Comments Off on ASIA MANUFACTURING COST DRIVER REPORT-Q3, 2017
ASIA MANUFACTURING COST DRIVERS REPORT
Q3 – 2017 (July, August, September)
Tracking The Trends Which Drive Costs In Asian Manufacturing
PLASTICS & RUBBER
– Most of the General Purpose plastic resin prices were up in the third quarter. PVC and PVC+DOT price up by 23.3% & 18.8% respectively, and the others up in price on average about 7.7%. TPE and EVA were the exception with a marginally down in price. Year over year, most plastic prices remain up in price versus one year ago. HIPS is up the most (over 35%) followed by PP (food grade) and HDPE up over 28% & 13% respectively and the others up in price on average about 6% . PE is only GP resin which is down marginally in price versus one year ago.
– And most Engineering plastic resin prices were increase in Q3 with PA6+30%fb price up by 21.6% followed by POM and ABS (on average about 10%). PC and Nylon PA66 up in price slightly, while PU Foam was down by 4.5% and Nylon PA6 was unchanged. Year over year, ABS is up in price the most at 42% followed by PC, Nylon PA6 and POM all up significantly(on average 17%), while PU Form price is down by 4.5% versus one year ago.
– In the Rubber category, prices were mixed in Q3. Polybutadiene(BR) saw a huge increase in price, up over 26% and Silicon was also up over 7% followed by CR and Rubber up a little while SCR5, Latex, Foam Latex and Nitrile were down sharply (close to 10%). Year over year, CR is up significantly (over 58%) and BR, SCR5 and EPDM up slightly in price while Latex is down over 50%. Rubber and NBR are down by 12% & 4% respectively versus one year ago.
METALS
– Meanwhile prices for Carbon Steel were all increase with Pig Iron, Tinplate, Steel Wire and Hot Rolled Steels rose in price between 12% and 19%. And Cold Rolled Steels was up over 7%. Year over year, the trend is more even with all grades of Carbon Steel up double digits over 41% on average.
– In the Stainless Steel part, all grades of Stainless Steel were up in price in the first quarter between 5% – 23%. Year over year, the trend remains up with all grades of stainless up in price on average by over 24% versus one year ago.
– And all aluminum grades rose in price 6%-17% in the first quarter, and year over year, most of aluminum prices are up significantly between 9% and 14% and A00 is up sharply in price by over 25%.
– Besides, in Other Industrial Metals, all the metals were up in price by 3.5%-14.3%. Year over year, all the metals prices are up by over 26% on average with Zinc up the most (over 40%) versus one year ago.
WOOD, PAPER & TEXTILES
– Wood prices inched slightly higher in Q3. Year over year, except for MDF which is down in price by 3.3%, the rest of wood price are up slightly between 0.8% and 5.9%.
– At the same time, Kraft, Corrugated, White and Gray Cardboard continued their rise while Art Paper remained unchanged. Corrugated is up the most (almost 48%) followed by Kraft up over 20% and White & Gray Cardboard were up slightly. Year over year, all paper prices remain higher, with Corrugated Board remaining up by almost 88% in price while all the others are on average by 22%.
– Most textile fabric prices were up slightly in the third quarter except 100% Polyester Fabric price was up over 13%. Year over year, all prices are higher, with 100% Polyester Fabric and Raw Cotton up in price the most at 26% and 8.5% respectively and the rest up more modestly at 0.75% to 2% versus one year ago.
CERAMIC AND GLASS RAW MATERIALS
In Ceramic Raw Materials, Alumina price is up the most over 34% in the Q3 and the others only up slightly. And in Glass Raw Materials Soda Ash was up in price sharply over 42% and Glass Sand marginally. Year over year, Alumina increase rapidly in price by over 70%, followed by Feldspar (close to 12%), Soda Ash and Kaolin only up a little. And Glass Grade Sand is also increase sharply by over 56% and Quartz up marginally versus one year ago.
FUEL
In third quarter, Fuel prices in China were continue on the rise and year over year, all fuels are up in price significantly by 19% to over 44% versus one year ago.
OCEAN FREIGHT
Ocean freight rates saw little changes in Q3 which is typical and there is little change from one year ago. However, the fourth quarter is expected to be volatile with many carriers looking for price hikes as many of the primary freight contracts will be renegotiated in Q4.
COST OF LABOR
Asian labor rates remained unchanged in the Q3. Year over year, rates are up in most countries with Indonesia up the most (over 8%) followed by Vietnam (up 7%), China (up 5%) and Thailand (up 1.7%) while India and Bangladesh remained unchanged.
CURRENCY EXCHANGE RATE
For the first quarter, the USD strengthened slightly against the Bangladesh Taka and weakened ever so slightly against the Chinese Yuan and Vietnamese Dong with the Thai Baht, NT Dollar and Indian Rupee stronger by about 5%. Year over year, the biggest gains for the USD are against the China RMB, Bangladesh Taka, Vietnam Dong and Indonesia Rupiah while its slightly weaker against the Thai Baht, NT Dollar and Indian Rupee.
CHINA TRADE (Data lags by one month)
– China Imports and Exports were both up marginally in the latest three months up by 4.7% & 4.3% respectively. Year over year, China Imports and Exports are both up by 13% & 4.5% from year ago levels.
– The China Producer Price Index (PPI) rose 0.85% in the third quarter and the China Consumer Price Index (CPI) up a little by 0.3%. Year over year, the China PPI is up over 10% while the China CPI is down slightly by 0.2% versus one year ago.
PURCHASING MANAGERS INDEX (PMI)
All the PMI Indexes have been climbing steadily throughout the quarter and all were above 50 at the end of the quarter. Year-on-year, all indexes show upward trends indicating growth and an expanding economy.
CONTACT US FOR MORE INFORMATION
Thank you for taking the time to follow trends in Asia manufacturing. Source International has operational offices in Louisville, Kentucky & Xiamen, China. Our passion is to partner with companies in supply management from Asia. We have a 25 year on-the-ground track record, a rigorous operating procedure, and a very well trained local staff. We welcome the opportunity to show you how we can add value to your supply chain in Asia and invite you to visit our offices and website to learn more about us.
For additional details, please refer to the charts that follow or contact one of our Operations Specialists for more information. Thank you for your support.
Data for this report comes from the sources listed and while every attempt is made to be as comprehensive and accurate as possible, please consider that these are just general trends and you should not draw any specific conclusions from the data. We recommend that any information provided in this report be weighed against other sources and experts on the individual topics covered and\, accordingly, we make no specific claims nor assume any liability from the use of the data contained herein.