ASIA MANUFACTURING COST DRIVERS REPORT – Q4 2016

Asia Manufacturing Cost Drivers were all on the rise in Q4 of 2016. It had to come eventually and the fourth quarter of 2016 certainly took the year out with a bang! Practically all raw materials tracked were on the rise with many showing the most significant increases in several years. Plastics, rubber, steel, brass, copper, nickel, corrugated paper, textiles, and ceramics prices were all up sharply (more than 10%), while wood and a few grades of aluminum, textiles were up only moderately (less than 10%). A few grades of aluminum, paper and ceramic/glass materials actually went down in price but they were few and far between. Petroleum products and fuels all rose sharply while labor rates were unchanged. The US Dollar was especially strong and appreciated against all of the Asian currencies. China imports and exports saw strong gains in the quarter and the China PPI and CPI were both up. And, lastly, all of the PMI indexes showed strength remaining well above 50 signaling an expanding economy in both Asia and the USA. See the chart of the general trends with green lights indicating positive trends, red lights indicating negative trends and yellow lights indicating caution relative to manufacturing costs. For all the details, please see the complete report, which follows.

ASIA MANUFACTURING COST DRIVERS REPORT – Q4 – 2016
PLASTICS & RUBBER

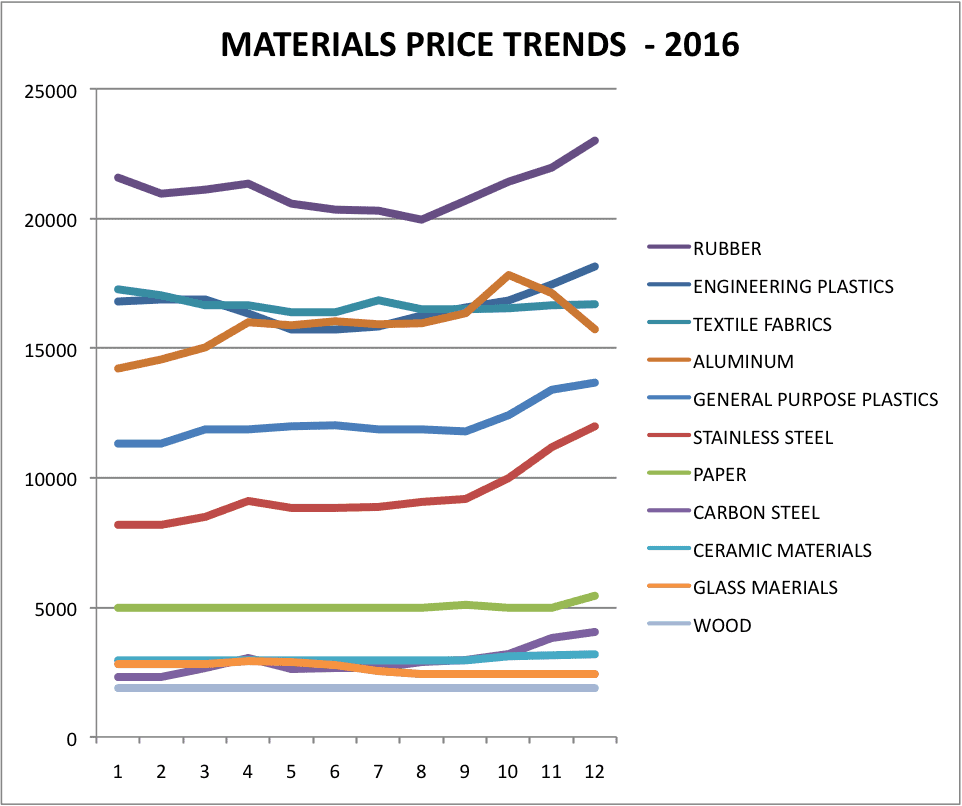
General Purpose plastic resin prices were all up significantly in the fourth quarter on average by over 15% lead by HIPS (+29%), PS (+21%) and PET (+18%). Year over year, all GP resins are up in price with HIPS and PS up the most (+54%) followed by PP and PVC both up over 40%. PE, HDPE, Food Grade PP and PET are up the least at 28%, 11%, 7%, and 4% respectively versus one year ago.

Engineering plastic resin prices saw more modest increases in the fourth quarter with Nylon (PA66) up 15%, PU Foam up 10%, POM up 6%, and Nylon PA6 up 3% while ABS was up a whopping 38%. PC bucked the upward trend and actually went down in price by 4%. Year over year, ABS is up 67%, Nylon PA66 is up 24%, PU foam up 10% followed by POM up 6% and PC up 5%. Only Nylon PA6 is down in price (22%) versus one year ago.

Rubber pries also rose in the fourth quarter as Polybutadiene (BR) Rubber took another huge jump up 42% more on top of the 29% increase in the third quarter. Natural Rubber and Neoprene (CR) were also up sharply by 17% and 23% respectively while EPDM rose 7%. Only Latex was down in price (11%). Year over year, rubber prices are mixed with BR (+120%), Neoprene (+24%), and Natural Rubber (+12%) all up in price while Latex (-34%), EPDM (-13%), and NBR (-5%) are down in price versus one year ago
METALS

In the fourth quarter of 2016, Carbon Steel prices rose sharply again another 30% or more on top of significant third quarter gains. Year over year, the trend is more pronounced with increases from 64%-98% versus year ago levels with Pig Iron up in price by 55%

All grades of Stainless Steel were also up in price in the fourth quarter between 24% and 38%. Year over year, the trend is also up with all grades up in price on average by 47% versus one year ago.

Aluminum grades on the other hand were the rare fourth quarter exception with prices actually dropping on average 5% in most cases with the exception of A00 Ingots, which rose 2%. Year over year prices, however, remain up on average by about 10% versus one year ago.

-Industrial Metals rose across the board in October and November before backing off in December with Brass, Copper, and Zinc ending the quarter up sharply by 15%, 17% and 11% respectively while Nickel saw a more moderate 3% increase. Year over year, all are well above year ago levels including Zinc up 48%, Nickel up 24%, Copper up 22% and Brass up 13% versus one year ago.
WOOD, PAPER & TEXTILES

Wood prices edged up 1% to 2% on average, which was the first increase this year.

Corrugated took a huge jump in the period up 50% and Kraft paper rose 10%. White and grey cardboard were slightly lower by 3%-4% and art paper was unchanged. Year over year, Corrugated is up 55%, Kraft up 10%, Art Paper 2% and both white and grey cardboard are both equal with year ago prices.

Textile prices also saw sharp increases with Polyester fabric up 18%, Nonwoven PP up 9%, T/C fabric up 5% and Cotton up only 1%. Year over year, all prices are higher except polyester which remains down in price by 24% versus one year ago.
GLASS & CERAMIC RAW MATERIALS


Alumina prices jumped another 41% in the fourth quarter after registering a 9% increase in the third quarter. Feldspar and Kaolin were also up in price by 7% and 3% respectively while quartz and glaze saw no change in prices. On the positive side, Soda Ash and Sand were down in price by 3% in the quarter. Year over year, Alumina is now up 78%, Feldspar and Soda Ash are both up 7% and Kaolin is up 3% while conversely Sand is down in price by 21% and Glaze is down by 2% versus one year ago.
FUEL
Fuel prices rose sharply in the fourth quarter by 30%-45% while year over year, fuel prices are up an average of 13%.
OCEAN FREIGHT
Ocean freight was one of the few items that saw no change in the fourth quarter, although our inside information says that some carriers got about 3% increase on contract renewals in the fourth quarter. Year over year, rates remain at historic lows 22%-43% below year ago levels. All indications, however, point to increases in 2017 after nearly 2 years of steady decreases to the current unsustainable levels.
COST OF LABOR
Asia labor rates saw no change in the fourth quarter and year over year, rates are up in most countries with Indonesia up the most (22%) followed by India and Vietnam (15%), and China (3%) while Bangladesh & Thailand stayed even.
CURRENCY EXCHANGE RATE
The USD gained strength in the fourth quarter appreciating 4% over the China Yuan, Taiwan Dollar, Indonesia Rupiah, and Thai Baht; 2% over the Vietnam Dong, and India Rupee and 1% versus the Bangladesh Taka. Year over year, the biggest gains for the USD are against the China Yuan (7%), India Rupee (3%), and Vietnam Dong (3%) while it was weaker against the Thai Baht (1%), Taiwan Dollar (1%), and Indonesia Rupiah (2%).
CHINA TRADE (Data lags by one month)
– China Imports and Exports were both up strongly in the three months ending in December, 10% and 3% respectively. Year over year, China Exports still remain down a fraction while China Import are up 6% from year ago levels.
– The China Producer Price Index (PPI) jumped 4.1% in the quarter while the China Consumer Price Index increased by 1%. Year over year, the China PPI is now up 10% for the year while the China CPI remains 1% above one year ago.
PURCHASING MANAGERS INDEX (PMI)
All of the PMI Indexes have been climbing steadily throughout the quarter and all were above 50 at year end. Year-on-year, all indexes continue to show upward trends indicating growth and an expanding economy.
FORWARD LOOKING ANALYSIS
2017 is shaping up to be a very interesting year for Asian manufacturing. The election of Donald Trump has lead to uncertainly as to the impact that his administration might have on global trade. Trump’s vague agenda in regards to USA infrastructure building, foreign trade restrictions and his populist agenda signal the basis for a continued strong dollar, inflationary pressures and a shakeup of foreign trade relations. The jury is still out and despite all the pre-election rhetoric, global economies could go either way, depending on how political momentum shifts in the Eurozone and which areas the Trump administration addresses first.
Key factors that are likely to impact commodity prices in 2017 include OPEC’s actions on oil supply, demand for Chinese goods and the overall global political climate. China saw somewhat of a manufacturing recovery through Q4 of 2016 with stronger than expected exports to Vietnam, Cambodia and Bangladesh. The India, Pakistan, Turkey and Indonesia economies were weaker and continued to suffer with currency and inflation issues. Ongoing themes include fluctuation in the global manufacturing and sourcing climate, rising labor costs, volatile oil and commodity prices, e-commerce and technological advancements in the supply chain combined with the massive consolidation in the container shipping industry, the geopolitical effect of the recent Brexit vote and the rise of ‘populist’ movements in the west are all significant impacts on global trade. As always, there is an increasing push for shorter lead times and lower prices. The status of major trade agreements such as the Trans-Pacific Partnership and NAFTA combined with geopolitical uncertainty, changing demographics, rapid technological advances, the rise of e-commerce, a lack of workers in China, volatile currencies, and increasing corporate social responsibility demands all lead to uncertainty in 2017. We’ll have to wait until Trump’s inauguration and the passing of the Lunar New Year holiday to get a better grasp on what the year will be looking like.
As of Q4, 2016, OPEC countries tentatively agreed to reduce oil supply by 2 million barrels per day in an effort to raise prices, which rose above the $40 per barrel range in the fourth quarter. Predictions are for relatively stable oil prices throughout the first half of 2017 though which should lead to more stable plastic and synthetic fabric prices (such as polyester), however, a lot depends on demand and production capacity.
Global rubber prices surged by close to 50% in the final quarter of 2016, mostly based on higher crude oil prices. This increase is prompting manufacturers to raise prices on both synthetic and natural rubber products, a trend which should continue into 2017.
Metal prices rallied through Q4 supported by a firm U.S. dollar and optimistic economic outlook. While the overall sentiment is bullish, volatility is expected into Q1 with uncertainty about the USA economic policy.
World cotton production and prices rose in 2016, which may put pressure on prices in 2H 2017, especially in light of increased China stockpiles. Wool prices ended 2016, with a 28% surge, a trend expected to continue through 2017. Leather prices also trended sharply up in late Q4 on the back of strong demand.
Excerpts from the Asia Inspection (AI) Q1 Barometer report provide additional insights:
- “After several slow quarters in the wake of increasing working costs and strong currency, China picked up pace again in 2016 (+12.5% YoY). It even outpaced some of its declared challengers, as Vietnam saw a more modest +5% growth, and Thailand was flat YoY. South of Asia continues to grow as a manufacturing powerhouse, especially for the Textile industry, as India and Pakistan saw audits and inspection volumes surge respectively +30.5% and +18.2% in 2016.
- “Overall, 2016 has seen a deterioration in manufacturing quality for consumer products worldwide: AI failure rate for product inspections in factories has grown by +8.8% in 2016 vs. 2015, with 35.8% of all inspections returning beyond acceptable level of defects.
- “Contrasting with the degrading manufacturing quality levels in factory, 2016 has seen rather promising results on product safety and performance testing in lab: AI lab tests failure rates overall have decreased by -11.4% in 2016, with 3.3% of all tests failing. It would appear that while brands and manufacturers have gotten better at properly designing and conceiving their products to comply with international standards, it is when mass production starts that most quality issues arise. Furthermore, a look past this overall encouraging figure for lab test results shows a more disparate reality. For instance, as demand for REACH-related testing in the EU has skyrocketed this year, test results have not been that good, with failure rates tripling YoY. The highest failure rates are found around phthalates testing, with as much as 5.4% tests not meeting safety requirements, indicating potentially harmful products.”
- “The state of structural safety remains troubling as 63% of factories audited in 2016 by AI were found in need of remediation, while the number of compliant factories has gone down from 41% in 2015 to 37%. Critical issues were found in 3% of factories, a slight improvement compared to the previous year. Meanwhile, ethical compliance continues presenting challenges: data collected from AI’s ethical audits during 2016 shows that a third of factories only were found compliant. While the number of critically non-compliant suppliers decreased (27% in 2016 vs. 41% in 2015), a large portion of suppliers are still ranked as “Amber”, indicating the need for improvement in the medium and long term. Among the top concerns in ethical compliance are a range of labor violations, including forced overtime, sexual harassment, child labor, forced labor, and exploitation of refugees. Environmental compliance was also uneven throughout global supply chains in 2016. According to AI data, over 36% of audits failed this year, a 5% increase from 2015. Overall, many brands are not prepared to make a commitment for ISO 14001 compliance right out of the gate, instead choosing to aim for the minimum legal standards applicable in their sourcing country. Nevertheless, more companies are committing to sustainability objectives in both short and long term, setting objectives for 2020 and beyond.”
CONTACT US FOR MORE INFORMATION
Thank you for taking the time to follow trends in Asia manufacturing. We’ll continue to provide objective reporting of the Asian Manufacturing Cost Drivers so you as supply professionals can make informed decisions for your companies.
Source International has operational offices in Louisville, Kentucky & Xiamen, China. Our passion is to partner with companies in supply management and manufacturing in Asia. We have a 25-year on-the-ground track record, a rigorous operating procedure, and a very well trained local staff and welcome the opportunity to show you how we can add value to your supply chain in Asia. Please take time to visit our offices and website to learn more about us. For additional details, please refer to the charts that are attached or contact one of our Operations Specialists for more information. www.sourceint.com
2016 Q4 COST DRIVERS REPORT DOWNLOAD
Data for this report comes from the sources listed and while every attempt is made to be as comprehensive and accurate as possible, please consider that these are just general trends and you should not draw any specific conclusions from the data. We recommend that any information provided in this report be weighted against other sources and experts on the individual topics covered and, accordingly, we make no specific claims nor assume any liability from the use of the data contained herein.
Comments are closed