ASIA MANUFACTURING COST DRIVER REPORT-Q3, 2017

ASIA MANUFACTURING COST DRIVERS REPORT
Q3 – 2017 (July, August, September)
Tracking The Trends Which Drive Costs In Asian Manufacturing
PLASTICS & RUBBER
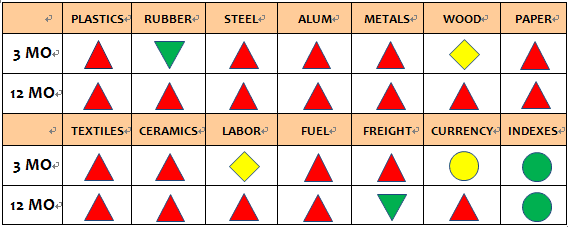
– Most of the General Purpose plastic resin prices were up in the third quarter. PVC and PVC+DOT price up by 23.3% & 18.8% respectively, and the others up in price on average about 7.7%. TPE and EVA were the exception with a marginally down in price. Year over year, most plastic prices remain up in price versus one year ago. HIPS is up the most (over 35%) followed by PP (food grade) and HDPE up over 28% & 13% respectively and the others up in price on average about 6% . PE is only GP resin which is down marginally in price versus one year ago.

– And most Engineering plastic resin prices were increase in Q3 with PA6+30%fb price up by 21.6% followed by POM and ABS (on average about 10%). PC and Nylon PA66 up in price slightly, while PU Foam was down by 4.5% and Nylon PA6 was unchanged. Year over year, ABS is up in price the most at 42% followed by PC, Nylon PA6 and POM all up significantly(on average 17%), while PU Form price is down by 4.5% versus one year ago.

– In the Rubber category, prices were mixed in Q3. Polybutadiene(BR) saw a huge increase in price, up over 26% and Silicon was also up over 7% followed by CR and Rubber up a little while SCR5, Latex, Foam Latex and Nitrile were down sharply (close to 10%). Year over year, CR is up significantly (over 58%) and BR, SCR5 and EPDM up slightly in price while Latex is down over 50%. Rubber and NBR are down by 12% & 4% respectively versus one year ago.

METALS
– Meanwhile prices for Carbon Steel were all increase with Pig Iron, Tinplate, Steel Wire and Hot Rolled Steels rose in price between 12% and 19%. And Cold Rolled Steels was up over 7%. Year over year, the trend is more even with all grades of Carbon Steel up double digits over 41% on average.

– In the Stainless Steel part, all grades of Stainless Steel were up in price in the first quarter between 5% – 23%. Year over year, the trend remains up with all grades of stainless up in price on average by over 24% versus one year ago.

– And all aluminum grades rose in price 6%-17% in the first quarter, and year over year, most of aluminum prices are up significantly between 9% and 14% and A00 is up sharply in price by over 25%.

– Besides, in Other Industrial Metals, all the metals were up in price by 3.5%-14.3%. Year over year, all the metals prices are up by over 26% on average with Zinc up the most (over 40%) versus one year ago.

WOOD, PAPER & TEXTILES
– Wood prices inched slightly higher in Q3. Year over year, except for MDF which is down in price by 3.3%, the rest of wood price are up slightly between 0.8% and 5.9%.

– At the same time, Kraft, Corrugated, White and Gray Cardboard continued their rise while Art Paper remained unchanged. Corrugated is up the most (almost 48%) followed by Kraft up over 20% and White & Gray Cardboard were up slightly. Year over year, all paper prices remain higher, with Corrugated Board remaining up by almost 88% in price while all the others are on average by 22%.

– Most textile fabric prices were up slightly in the third quarter except 100% Polyester Fabric price was up over 13%. Year over year, all prices are higher, with 100% Polyester Fabric and Raw Cotton up in price the most at 26% and 8.5% respectively and the rest up more modestly at 0.75% to 2% versus one year ago.

CERAMIC AND GLASS RAW MATERIALS
In Ceramic Raw Materials, Alumina price is up the most over 34% in the Q3 and the others only up slightly. And in Glass Raw Materials Soda Ash was up in price sharply over 42% and Glass Sand marginally. Year over year, Alumina increase rapidly in price by over 70%, followed by Feldspar (close to 12%), Soda Ash and Kaolin only up a little. And Glass Grade Sand is also increase sharply by over 56% and Quartz up marginally versus one year ago.


FUEL
In third quarter, Fuel prices in China were continue on the rise and year over year, all fuels are up in price significantly by 19% to over 44% versus one year ago.
OCEAN FREIGHT
Ocean freight rates saw little changes in Q3 which is typical and there is little change from one year ago. However, the fourth quarter is expected to be volatile with many carriers looking for price hikes as many of the primary freight contracts will be renegotiated in Q4.
COST OF LABOR
Asian labor rates remained unchanged in the Q3. Year over year, rates are up in most countries with Indonesia up the most (over 8%) followed by Vietnam (up 7%), China (up 5%) and Thailand (up 1.7%) while India and Bangladesh remained unchanged.
CURRENCY EXCHANGE RATE
For the first quarter, the USD strengthened slightly against the Bangladesh Taka and weakened ever so slightly against the Chinese Yuan and Vietnamese Dong with the Thai Baht, NT Dollar and Indian Rupee stronger by about 5%. Year over year, the biggest gains for the USD are against the China RMB, Bangladesh Taka, Vietnam Dong and Indonesia Rupiah while its slightly weaker against the Thai Baht, NT Dollar and Indian Rupee.
CHINA TRADE (Data lags by one month)
– China Imports and Exports were both up marginally in the latest three months up by 4.7% & 4.3% respectively. Year over year, China Imports and Exports are both up by 13% & 4.5% from year ago levels.
– The China Producer Price Index (PPI) rose 0.85% in the third quarter and the China Consumer Price Index (CPI) up a little by 0.3%. Year over year, the China PPI is up over 10% while the China CPI is down slightly by 0.2% versus one year ago.
PURCHASING MANAGERS INDEX (PMI)
All the PMI Indexes have been climbing steadily throughout the quarter and all were above 50 at the end of the quarter. Year-on-year, all indexes show upward trends indicating growth and an expanding economy.
CONTACT US FOR MORE INFORMATION
Thank you for taking the time to follow trends in Asia manufacturing. Source International has operational offices in Louisville, Kentucky & Xiamen, China. Our passion is to partner with companies in supply management from Asia. We have a 25 year on-the-ground track record, a rigorous operating procedure, and a very well trained local staff. We welcome the opportunity to show you how we can add value to your supply chain in Asia and invite you to visit our offices and website to learn more about us.
For additional details, please refer to the charts that follow or contact one of our Operations Specialists for more information. Thank you for your support.
YOU CAN DOWNLOAD THE COMPLETE REPORT HERE
Data for this report comes from the sources listed and while every attempt is made to be as comprehensive and accurate as possible, please consider that these are just general trends and you should not draw any specific conclusions from the data. We recommend that any information provided in this report be weighed against other sources and experts on the individual topics covered and\, accordingly, we make no specific claims nor assume any liability from the use of the data contained herein.
Comments are closed