Asia Manufacturing Cost Drivers – 4/16

Source International Asia Manufacturing Cost Drivers Synopsis – April, 2016
Commodity Prices
General Plastic prices saw a decrease in price for most varieties in April with the exception of General Purpose PP and PET which increased 3.6% and 2%, respectively. The biggest decline in plastics pricing was seen in High Impact PS, while Food Grade and HDPE varieties remained flat. Year over year, prices are a mixed bag with half our tracked grades showing increases ranging from slight above 1% to 9% and the other half showing decreases from 2.6% to 24.1%.
All Engineering Grade Plastics either saw a decline or remained flat during April. The largest decline was seen in the PA6 market with an overall decrease in price of 5.6%, while both ABS and POM remained flat as they have for the past six months. Year over year prices are also all down significantly or flat with PA6 registering a massive 32.8% drop.
Most Rubber prices saw substantial increases in price with the exception of Latex which decreased by 4.5%. Increases in Rubber prices for April ranged from 5.8% for Rubber Blanket to 15.4% for Tire Rubber. Although prices were mainly up in April, the prices for Rubber in the last year still remain 19.1% lower on average across the board.
Carbon Steel prices rose sharply in April. Hot Rolled Steel was up anywhere from 14.7% to 17.7%, while Cold Rolled Steel saw increases ranging from 12.8% to a hefty 29%. In the past six months, Carbon Steel prices have seen an average increase of 38.6%, although Pig Iron has dropped nearly 20% in the same period indicating that the increases may be hard to withstand going forward.
Stainless Steel prices were all up with the exception of Stainless Steel Sheet 430 which saw a 2% decline. Increases in Stainless Steel ranged from 0.6% to 13.8% with Stainless Steel Sheet 304 registering the biggest uptick in price. Over the past six months, Stainless Steel prices have been up an average of 6.3% across the board, although prices have been generally up slightly or down slightly year over year.
Aluminum prices continued to climb in April with Aluminum Ingots leading the pack with an 11.9% increase. Perhaps the most impressive trend in Aluminum pricing is the over 50.1% increase in Aluminum 6061. In the last six months, the lowest increase in price has been that of Aluminum 3003 with a 16.6% uptick. The six month average price increase in the Aluminum market is 27.5%.
In other metals, Zinc Alloy continued to post gains and rose 7.1% while Brass Tube decreased nearly 2% and Brass Rod increased marginally. Copper showed a slight increase of 1.6%. Nickel continued to rise, as in the previous 3 months, and went up 8.6%. Excluding Zinc, other metals are down significantly year over year by an average of 27.2% with the biggest decreases being realized in the Brass and Nickel markets.
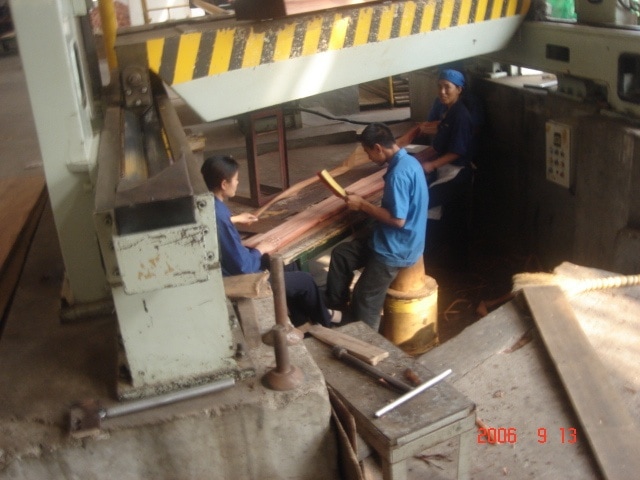
Wood prices remained the same and continue to be about 2% lower on average than a year ago. The only exception to this is MDF Board, which has remained completely unchanged all year.
Paper prices remained unchanged in April as they have for the past three months with the exception of Corrugated which was up nearly 1% in the same period. Gray Cardboard has shown a 6.9% gain year over year despite prices remaining unchanged for over six months.
Textile Fabrics were largely flat with the exception of Cotton, which went up 3.6%, and Polyester Fabric which fell nearly 2%. Year over year most fabrics have remained flat, however Cotton has seen an 8.8% drop and Polyester Fabric has realized a 31.5% decrease.
Excluding Alumina, Ceramics prices remained unchanged in April. Alumina continued to rise in price and showed a 2% increase in overall price. With the exception of Quartz, which is up 5.5% for the year, Feldspar, Kaolin, and Alumina are all down posting decreases of 6.6%, 4.8%, and 22.8%, respectively.
Labor, Fuel, Freight, and Currency
Asian Labor Rates in China, Bangladesh, and Thailand stayed flat during the reporting period. In fact, Labor Rates in these markets have remained flat all year with the exception of China which has posted an increase of 2.2%.
The Fuel and Power sector seemed to stabilize in April compared to the heavy decreases seen in the past three to twelve months. China Petrol decreased slightly to 1.3% while Natural Gas and LPG Gas realized gains of 1.7% and 3.8%, respectively.
Ocean Freight rates remained flat during the reporting period potentially finding a current equilibrium compared to the large decreases over the last several months. A lot of capacity remains unfilled so any increases this year seem unlikely. Year over year Freight rates to the east and west coasts are down 21.8% and 42.6%, respectively.
With the exception of the Thai Baht, which rose 0.5%, all Asian Currencies saw decreases in the value of their currency. The Chinese Yuan was down 0.4% as compared to the US Dollar, while the Indian Rupee was down 0.3%. Asian Currencies are down nearly 4% year over year.
Key Indexes
Both China PMI Indexes were down in April with Mainland China seeing a 0.2% drop and Hong Kong seeing a 0.6% drop. The USA PMI dropped over 2% from 51.8 to 50.8. Although Mainland China PMI and the US PMI are above 50, they appear to be in decline and hovering closer and closer to below the 50 benchmark signaling contracting economies.
There was good news with regard to China Imports and Exports. Imports in China saw a 40% jump while exports realized a 27.5% jump. Year over year imports are down 7.4% while exports are up 11.2%. These numbers are encouraging as both imports and exports were down more than 10% just a couple months ago. It should be noted this data lags behind one month.
The China Producer Price Index (PPI) was up slightly recording a 0.6% gain while the China Consumer Price Index remained flat. The China PPI is up 0.3% for the year while the China CPI is up 0.9% for the year. Again, these are positive indicators pointing toward a potentially improving economy.
For additional details or questions, please refer to the charts that follow or contact one of our Operations Specialists for more information.
Download the full report below.
Source International – April 2016 – Asian Manufacturing Cost Drivers Full Report
Comments are closed