ASIA MANUFACTURING COST DRIVERS REPORT Q2– 2019 (Apr, May, Jun) Tracking The Trends Which Drive Costs In Asian Manufacturing

Executive Summary
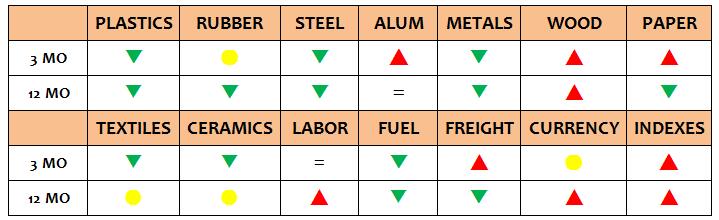
The commodity price trends in the second quarter are down in Asia. Many grades of Plastics, Steel, Metals, Fuel, Textiles and Ceramics raw materials prices were mostly down in price. While some grades of Alum, Wood and paper prices were all up. Labor rates were steady in the lower wage countries. The trend for World Container Index was increase. Only Rubber prices were mixed. The US Dollar was up a little bit against most of the Asian currencies in Q2. China imports and exports saw slightly up in this quarter. The China CPI was steady, and the China PPI was down marginally. The PMI indexes saw slightly down in Q2, PMI China was steady, while PMI Hong Kong and PMI USA saw faintly decreasing. Below is a chart of the general trends and for all the details, please see the entire report.

Report Details
PLASTICS & RUBBER
– Most of General Purpose plastic prices were down in second quarter. PP(Food Grade), PE (LD400/Injection) and PP (K8303) were all down over 3%, PVC (S700) and HIPS (PH88) both down marginally, while others were unchanged. Year over year, expect for HDPE (HHMTR210) up 3.8%, and PE (LD400/Injection) is steady, balance of the general plastic prices are down over 6% versus one year ago.

– Similarly, the second quarter of engineering plastic prices were down, except for Nylon (PA6) up 2.6%, ABS, PC (L-1250Y) and PU Foam were all down slightly. POM and Nylon (PA66) are both steady. Year over year, ABS in price is obviously down 17.4%, followed by PC (L-1250Y) down 4.8% and PU Foam is faintly down 2.1%, while the other prices are up on the average of 5.8% versus one year ago.

– Most of the Rubber prices were down in Q2, SCR5 saw a little up which is over 2%. EPDM saw obviously down in price, which was over 8%. Latex, CR prices were all down over 2%, BR9000 was down marginally. NBR price was steady. Year over year, SCR5, Latex and NBR prices slightly up which are over 2%, while EPFM in price is down 8.3%, followed by CR down 3% and BR9000 down 2.6% versus one year ago.

METALS
– For the second quarter of 2019, most of the prices for Carbon Steel were down. Hot Roll Steel Tube Cold Roll Steel Sheet and Cold Roll Steel Tube in price were down 6.1%, 5.9% and 2.3% respectively. While Hot Roll Steel Sheet and Steel Wire were both up over 2%. Pig Iron is unchanged. Year over year, expect for Steel Wire and Pig Iron are steady. Other carbon steels in price are down on the average 8.3% versus one year ago.

– In the Stainless Steel part, most of the grades of prices were down in the second quarter, with 410, 430 and 304 in price down on average of 3.5%, while 402 and 201 in price were up 3.4% and 0.6% respectively. Year over year, all the Stainless Steel prices are down over 4% versus one year ago.

– All aluminum prices were up faintly in the second quarter. Year over year, Only 6061 in price is up 2.5%, the rest of grades are down on the average of 0.9% versus one year ago.

– In Other Industrial Metals, all grades trend was decreasing in Q2, with Copper and Nickel in price were both down over 7%, Zinc and Brass Rod prices were down 5.3% and 3.9% respectively. Year over year, Zinc’s price is sharply down 18.6%, followed Nickel price up 15.2%, Copper price down 9.6% and Brass Rod price is down marginally versus one year ago.

WOOD, PAPER & TEXTILES
– Wood prices were slightly higher in Q2, except for Beech Hardwood was steady in price, Pine Softwood and MDF prices were up 0.5% and 1.6% respectively. Year over year, Beech Hardwood and Pine Softwood are up marginally, while MDF price is down 1.5% versus one year ago.

– Similarly, most grades prices of Paper Materials were up in the second quarter, with Kraft paper was sharply up 24.6%, followed Gray Cardbord was up 15.2% and White Cardboard was up 12.2% in price. While Corrugated Board and Art paper prices were down 14.7% and 7.4% respectively. Year over year, the trend for paper price is decreasing, with Corrugated Board and Art Paper both enormously down over 23%, Kraft paper is down marginally. Kraft paper and Gray Cardbord are up faintly versus one year ago.

– Textile fabric prices saw a little change in the second quarter, with Raw Cotton price was down 6.7% in price. While the rest grades prices were steady. Year over year, the grade in prices are mixed, with Raw Cotton price is sharply up 13.5%, but 100% Polyester Fabric price is up 5%. The rest of Textiles prices are unchanged versus one year ago.

CERAMIC AND GLASS RAW MATERIALS
-In Ceramic Raw Materials, the grades in price were up in Q2, with Alumina was obviously down 8.9%, Kaolin, Feldspar and Soda Ash were all up slightly. Year over year, Alumina is up moat which is over 17%, Kaolin’s price is up 2.3%. While other Ceramic and Glass material prices are up on the average of 4.7% versus one year ago.

FUEL
Fuel prices in China were generally going down, with LPG , Diesel Oil and Natural Gas prices were obviously down in the range of 2% ~15% in the second quarter. However, Petroleum price was unchanged. Meanwhile, year over year, all Fuel prices are decreasing in price, with Diesel Oil in price is significantly down 20.4%, the rest fuels are down slightly in price between 8%~15% versus one year ago.
OCEAN FREIGHT
The World Container Index was faintly up 0.4% in the second quarter. To the contrary, year over year, the World Container Index is slightly up 2% versus one year ago.
COST OF LABOR
All of the Asian labor rates were unchanged in Q2.Year over year, rates are up in most countries with Bangladesh rate is sharply up the most (over 50%) followed by Indonesia (up 9.4%), Vietnam and India both up over 5%, and China is up marginally.
CURRENCY EXCHANGE RATE
For the second quarter, the USD was slightly strength against the Vietnam Dong, India Rupees, China RMB and Taiwan New Dollars, while slightly weaker against Thailand Baht Bangladesh Taka and Indonesian Rupiah. Year over year, the biggest gains for the USD are against the China RMB, slightly strength against India Rupees, Bangladesh Taka, Taiwan New Dollars, and Vietnam Dong while its slightly weaker against the Thai Baht and Indonesia Rupiah.
CHINA TRADE (Data lags by one month)
– China Imports was slightly up 3.73% and Exports was obviously up7.65% in the second quarter. Year over year, China Imports is slightly down 1.66% while Exports are up 1.34% versus one year ago.
– The China Consumer Price Index (CPI) was unchanged while the China Producer Price Index (PPI) was faintly down 0.6% in the second quarter. Year over year, the China PPI is down 4.49% while the China CPI is up marginally versus one year ago.
PURCHASING MANAGERS INDEX (PMI)
USA PMI and Hong Kong PMI were both down slightly. Only China PMI was unchanged in the second quarter. Year over year, China PMI, China PMI and USA PMI are both down slightly, with UPS PMI down most which is over 14% followed by China PMI down 4.08%, while Hong Kong PMI is up 1.63% versus one year ago.
CONTACT US FOR MORE INFORMATION
Thank you for taking the time to follow trends in Asia manufacturing. Source International has operational offices in Louisville, Kentucky & Xiamen, China. Our passion is to partner with companies in supply management from Asia. We have a 26 year on-the-ground track record, a rigorous operating procedure, and a very well trained local staff. We welcome the opportunity to show you how we can add value to your supply chain in Asia and invite you to visit our offices and website to learn more about us.
For additional details, please refer to the charts that follow or contact one of our Operations Specialists for more information. Thank you for your support.
Visit our :https:/
Data for this report comes from the sources listed and while every attempt is made to be as comprehensive and accurate as possible, please consider that these are just general trends and you should not draw any specific conclusions from the data. We recommend that any information provided in this report be weighed against other sources and experts on the individual topics covered and\, accordingly, we make no specific claims nor assume any liability from the use of the data contained herein.
Comments are closed