Asia Manufacturing Costs Higher in Q2 – 2021

Asia Manufacturing Costs Increased in Q2-2021 Driven by Supply Chain Disruptions, Raw Material Increases, and Higher Transportation Costs
Q2 EXECUTIVE SUMMARY – Asia Manufacturing Costs saw sharp rises in raw material costs and strains in supply chains in Q2. Meanwhile, contrained output and the spread of new COVID variants (especially in India) fueled further negative impact on productivity and supply chains. These factors coupled with logistics issues at Asian and US ports and surges in transportation costs are further complicating the situation and driving higher prices.
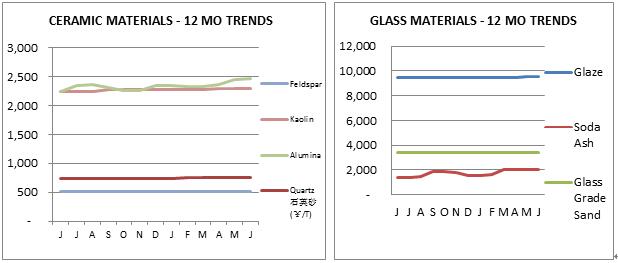
The commodity price trends in the second quarter all showed significant upward movements continuing the trends of the past few quarters. Most grades of steel, aluminum, other metals, ceramic raw materials, and fuel all showed increases while only plastics and paper retreated slightly from significant increases earlier in the year. Wood, textiles, and labor costs meanwhile were mostly flat in price. The World Container Index increased by 19.6% in Q2 continuing the uptick in logistics costs this year and was by far the highest in recent years. China exports surged 16.7% versus Q1 reflecting the strong demand in the marketplace with heavy order volume. China’s producer prices rose by 8.8% year-on-year in June 2021 after a 9.0% gain in May and was the sixth straight month of increases in factory prices.
The outlook for Asia manufacturing production in the second half of 2021 continues to be strong led by the rapid expansion forecast for world economic growth of around 5% year over year.
For all the details please see the entire report that follows:
PLASTIC RESINS & RUBBER
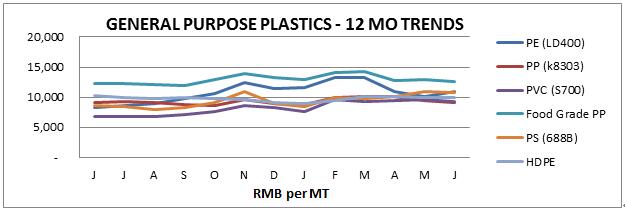
Most general purpose plastic prices were down in June, except PE (up 8.9%) and HDPE (flat). Year over year, most general plastic prices were up on average of 16.2%, led by HIPS up 47.6%, PVC up 37.0%, PE up 31.7%, PS up 25.6% and PS up 25.6 % from one year ago.
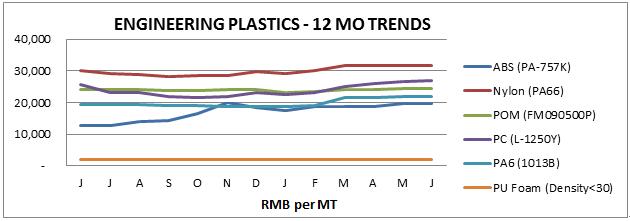
Engineering plastic prices were mostly unchanged in Q2 versus last quarter with PA down 6.8%, and PC up 1.5%. Year over year, ABS increased the most at 53.1% followed by PA up 14.6%.
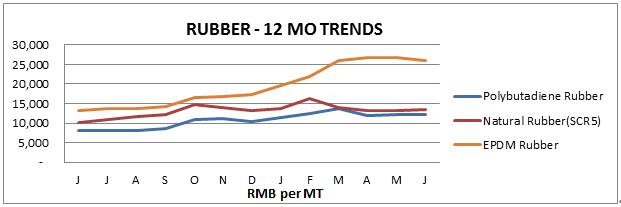
Prices for rubber in Q2 were mixed. Polybutadiene rubber was down 0.8%, natural rubber was up 1.1%, and EPDM rubber was down 3.0%. Year over year the trends looked quite different with Polybutadiene rubber up 47.6%, natural rubber up 32.7% and EPDM up 95.5%.
STEEL, ALUMINUM, AND OTHER INDUSTRIAL METALS
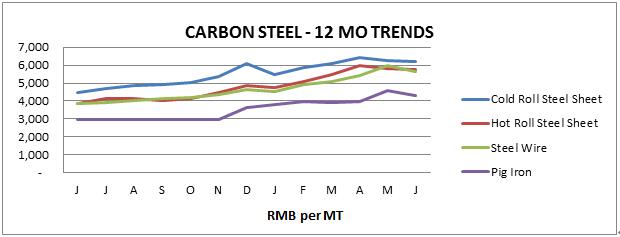
Carbon steel was up on average 7.5% with cold rolled steel sheet was up 2.3%, hot rolled steel plate up 4.9%, steel wire up 11.6%, and pig iron up 10.2% versus Q1. Year over year, most grades of carbon steels were up significantly, on average 41.9% versus one year ago.
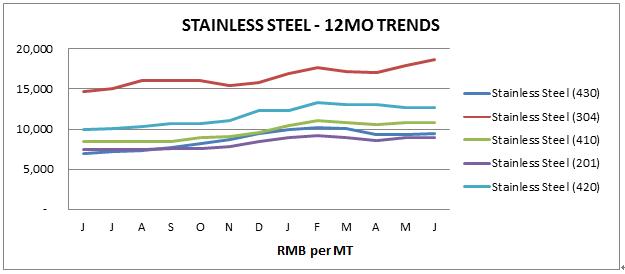
For the stainless steel grades, 304 was up 4.5% while other grades were mostly flat for the quarter. Year over year trends however showed a different trend with 430 up 34.3%, 304 up 26.9%, 410 up 27.1%, 201 up 21.6%, and 420 up 26.5% versus one year ago.
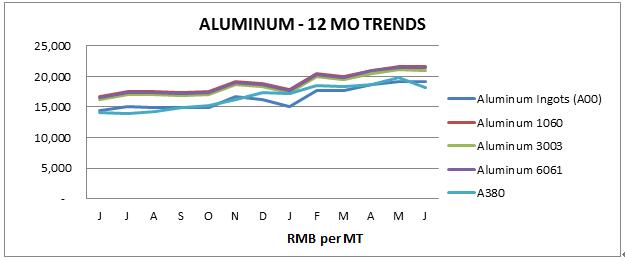
Aluminum prices retreated 2.3% in the last month of the quarter, but prices increased by 5.5% versus last quarter. Year over year, all aluminum prices increased on average 30.2% with A00 up 33.0%, 1060 up 28.9%, 3003 up 29.4%, 6061 up 28.7% and A380 up 29.9% versus one year ago.
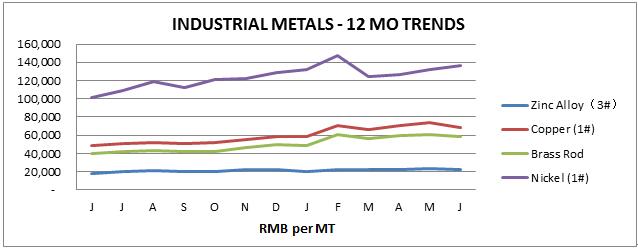
In the other industrial metals, June saw some price declines, however nickel bucked the trend up 10.0% versus last quarter. Year over year, brass rod increased 47.2%, Copper increased 40.2%, Zinc Alloy increased 27.4% and Nickel increased 35.3%.
WOOD, PAPER & TEXTILES
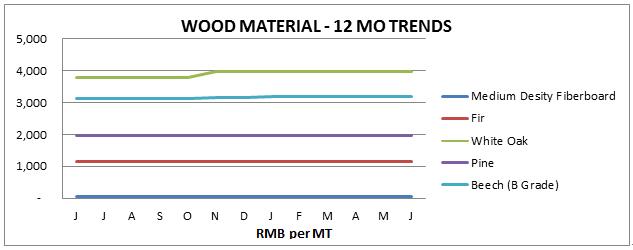
Wood prices remained steady in Q2 unlike the trend in the US. Year over year, was pretty much the same with MDF down and White Oak was up versus one year ago.
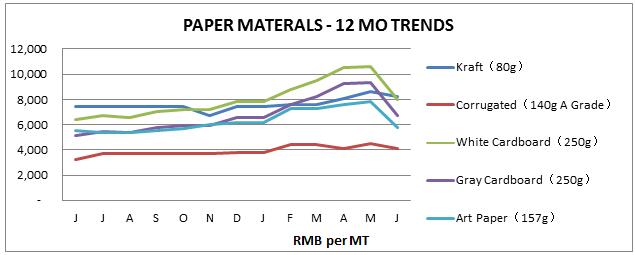
Paper materials reversed their upwards trends in Q2, down on average by 18.1%. Only kraft paper was up for the quarter by 8.6%. Year over year, paper materials were up on average by 20% versus one year ago
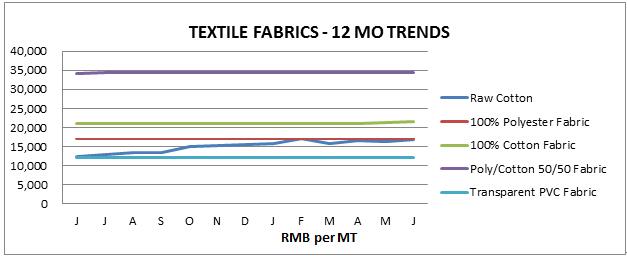
Textile fabric prices were mostly unchanged in the second quarter, except raw cotton which was up in price by 5.3%. Year over year, textile prices were stable except raw cotton which was up 34.6% versus one year ago.
FUEL, FREIGHT, LABOR, AND MORE
FUEL
Fuel prices in China increased on average 7.8%, with Petroleum up 14.9%, Natural Gas up 13.6% and LGP gas up 9.6%. Year over year, the trend for fuel prices were up significantly on average 57.5% versus one year ago.
COST OF LABOR
One bright spot is that the labor rates in most of the Asa countries were unchanged in Q2. Year over year, India and Indonesia were up 12.3% and 3.3% respectively with China, Vietnam, and Indonesia without major movements.
OCEAN FREIGHT
Ocean freight showed the greatest increase in price and was up 41.3% in Q2 versus Q1 and up a whopping 370% year over year according to the World Container Index. The US containerized import market is still roaring with rates predicted to increase again mid-July. Capacity continues to be booked at least six weeks out and imported freight arrives to congested US ports and overloaded rail yards driven by replenishment orders for retailers. Even with extra capacity that has been added by carriers, industry analysts are continuing to warn that the constraints on capacity will continue to be felt throughout 2021 as the market deals with the continued surge of demand.
CURRENCY EXCHANGE RATE
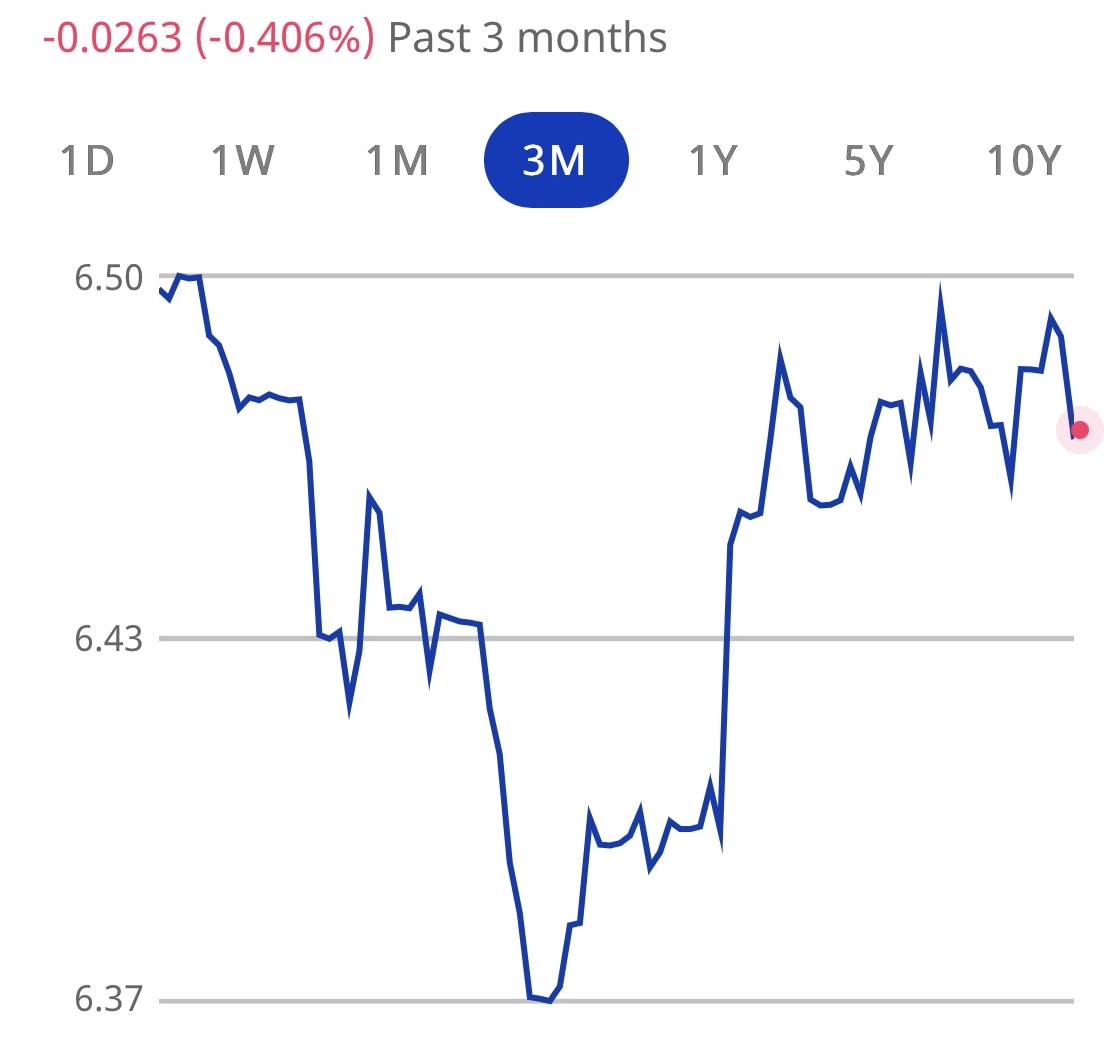
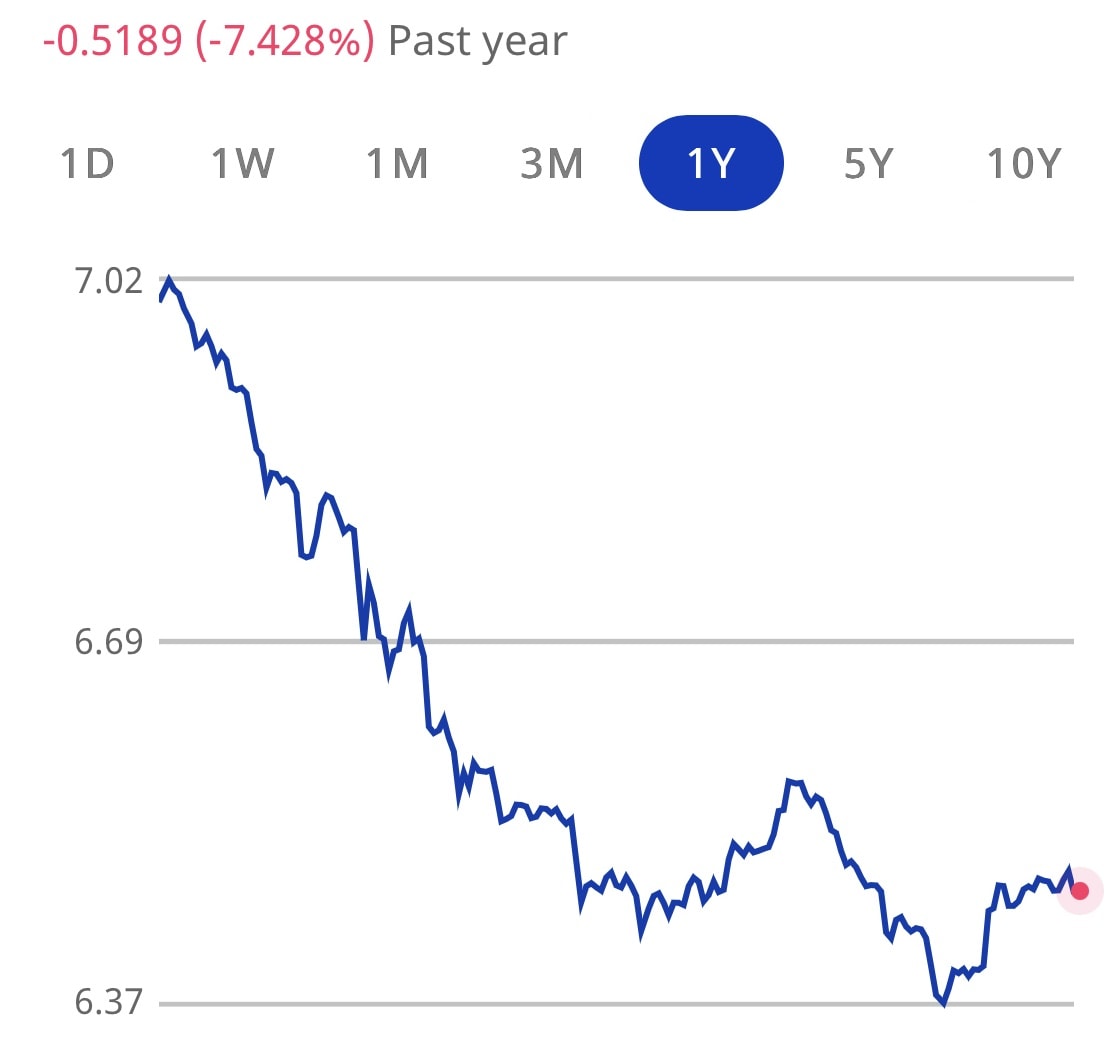
For the second quarter, the USD was weaker against the China RMB by 0.4%, Vietnam Dong by 1%, and by 1.9% against the Taiwan Dollar and stronger against the Thai Baht by 2.4% and only slightly stronger against the India Rupees (0.2%), Bangladesh Taka (0.2%) and Indonesian Rupiah (0.1%). Year over year, the USD has weakened against most Asian currencies with China RMB being the strongest up by 7.4% followed by Taiwan up 5.3%. At the end of Q2 the RMB exchange rate was holding steady about 6.45 to 1 USD.
CHINA TRADE
For Q2, China imports were up about 1% and exports remained strong up 16.7% versus Q1. Year over year, China imports and exports were both up strongly at 37.5% and 31.8% respectively versus one year ago.
PURCHASING MANAGERS INDEX (PMI)
The China PMI dropped slightly in June to 50.9 from 51.0 in May while the US PMI remained storng while dropping slightly to 60.6 in June from 61.2 in May. Year over year, the China PMI remained about flat while the US PMI was up substantially at 60.6 from 52.3 one year ago (June).
A very good analysis of current Asia Manufacturing Trends this quarter was published by Reuters recently and can be found at this link.
CONTACT US FOR MORE INFORMATION
Thank you for taking the time to follow trends in Asia manufacturing. Source International has operational offices in the USA, China, and Vietnam. Our passion is to partner with companies in supply management from Asia. We have a three-decade track record of on the ground operations in Asia, a rigorous, agile operating system, and a very well-trained local staff. We welcome the opportunity to show you how we can add value to your supply chain in Asia and invite you to visit our operations in USA and Asia to learn more. For additional details, please Contact our team.
* Data for this report comes from various sources and while every attempt is made to be as comprehensive and accurate as possible, please consider these as general trends and you should not draw any specific conclusions from the data. We recommend that any information provided in this report be weighed against other sources and experts on the individual topics covered and, accordingly, we make no specific claims nor assume any liability from the use of the data contained herein.


Comments are closed