Asia Manufacturing Stalled in Q3, 2021

Asia Manufacturing Stalled in Q3, 2021 Due to Energy Shortages, COVID Outbreaks, Material Supply Constraints, And Transportation Backlogs
Q3 EXECUTIVE SUMMARY –
Asia Manufacturing Stalled in Q3, 2021 Due to Energy Shortages, COVID Outbreaks, Material Supply Constraints, And Transportation Backlogs. Factory output in Asia slowed in the third quarter as manufacturers battled COVID spikes, worker shortages, material supply constraints, and energy shortages. Raw materials continued their upward trends for the most part and transportation backlogs compounded the global supply chain problems.
The commodity price trends in the third quarter all showed upward movements continuing the trend for all of 2021. Most grades of steel, aluminum, other metals, ceramic raw materials, and especially fuel all showed significant increases while only rubber and paper slowed their climb upwards. Wood, textiles, labor costs, and the exchange rate remain stable meanwhile were mostly flat but showing little decline. Freight costs continued their move upward with The World Container Index up 46.02% over Q2 reaching all-time highs.
Chinese imports were up 4% and exports were up over 8% versus Q2. And, while the CPI declined slightly, the PPI has risen over 9% this year hitting a 13-year high. The China PMI index was at 49.6 in September versus 50.1 in August slipping into contraction for the first time since February 2020.
Unfortunately, the outlook for Q4 does not have many promising signs for quick relief and a continuation or worsening of prices is likely as we move into the holiday season. Demand remains strong from both North America and Europe, and it remains to be seen if rising prices will temper that demand into 2022.
For all the details please see the entire report that follows:
PLASTIC RESINS & RUBBER
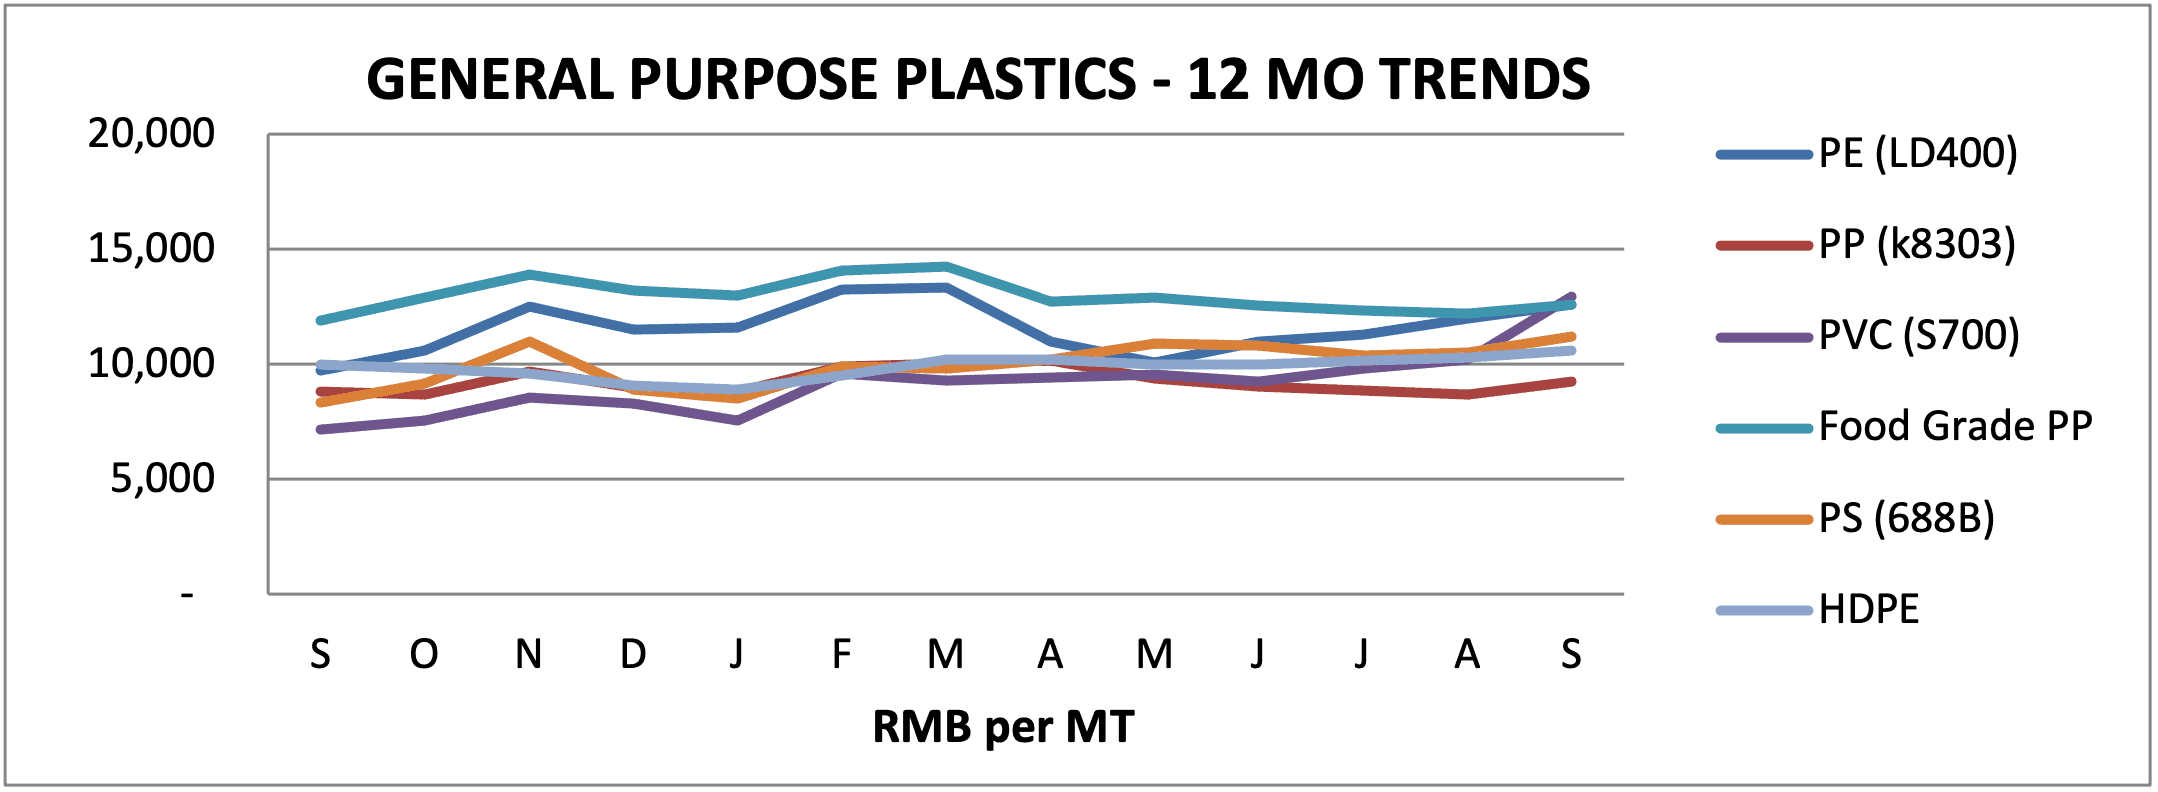
All general-purpose plastic prices were up in Q3 on average by 6% except HIPS which was down 1%. Year over year, general-purpose plastic prices have risen an average of 24%, led by PVC up over 80%, followed by EVA up 66% and PS up 34%.
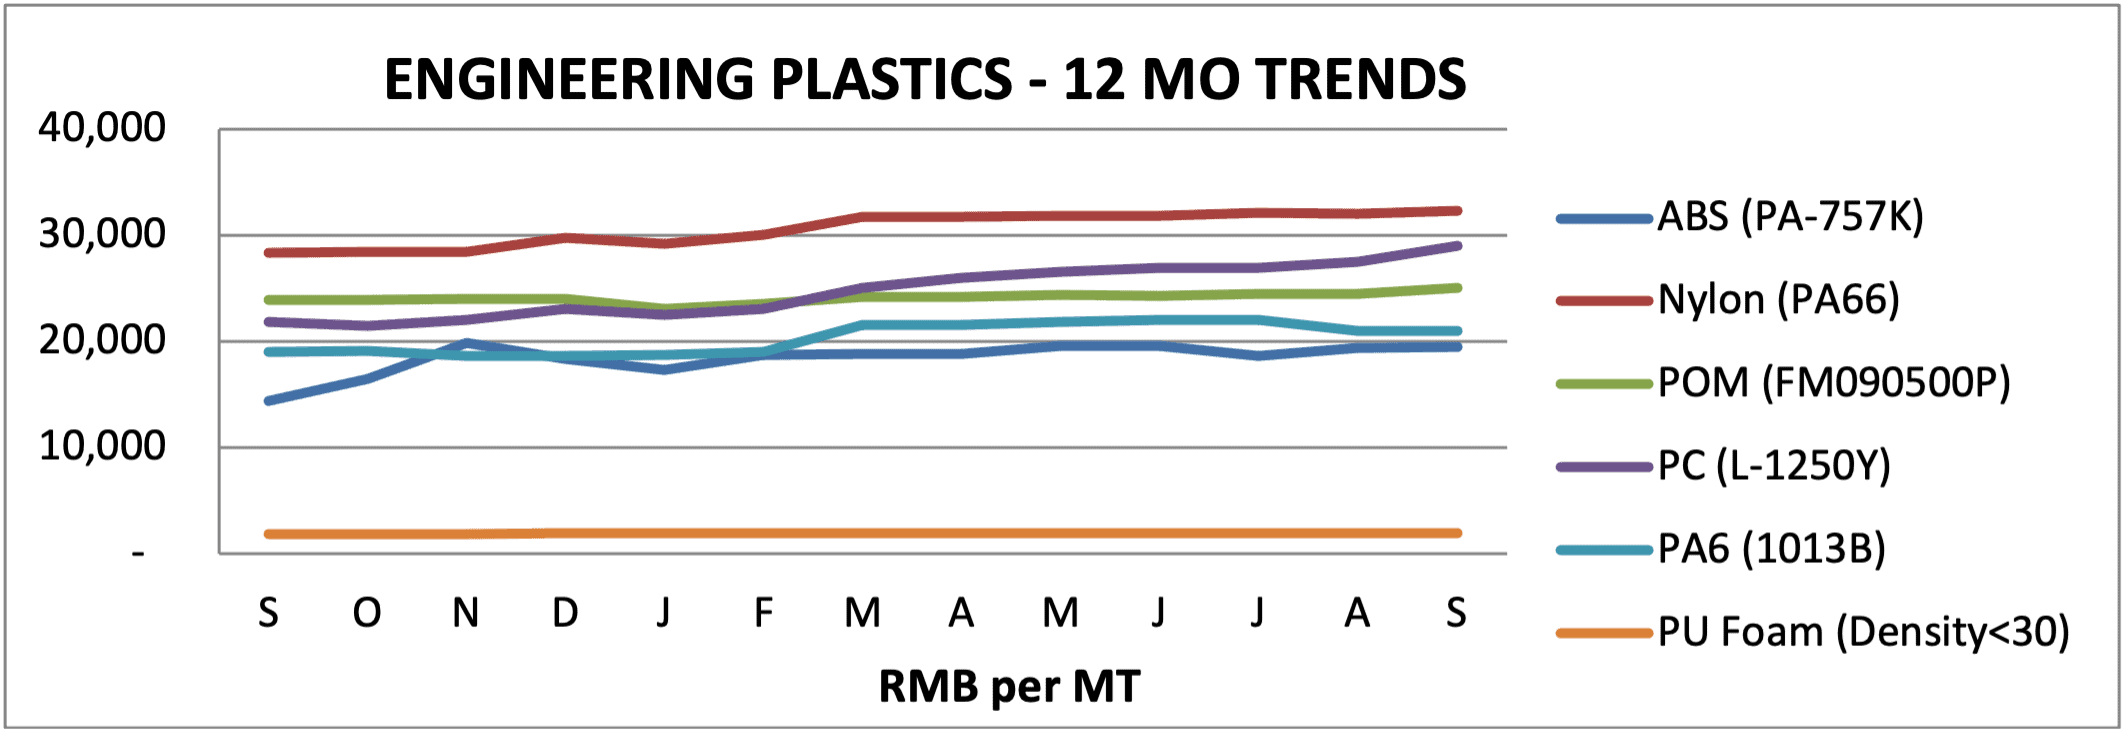
Engineering plastic prices were mixed in Q3 with PA up the most at over 14% and PC down almost 8%. Year over year, prices were up by average 11%, led by ABS up 36%, PC up 33%, and Nylon up 14% with only PA and Tritan down year over year 3% and 1% respectively.
Rubber prices were more mixed in Q3 with Silicon up 55%, Neoprene up 23%, and Polybutadiene up 10%, while Latex, EDPM, and Nitril were down 8%, 6%, and 5% respectively and Natural Rubber showed little change. Year over year, all rubber prices are up significantly with EPDM leading the pack up over 70%, followed by Silicon, Nitril and Neoprene up 35%, 26%, and 20% respectively with only recycled rubber down slightly by less than 5%.
STEEL, ALUMINUM, AND OTHER INDUSTRIAL METALS
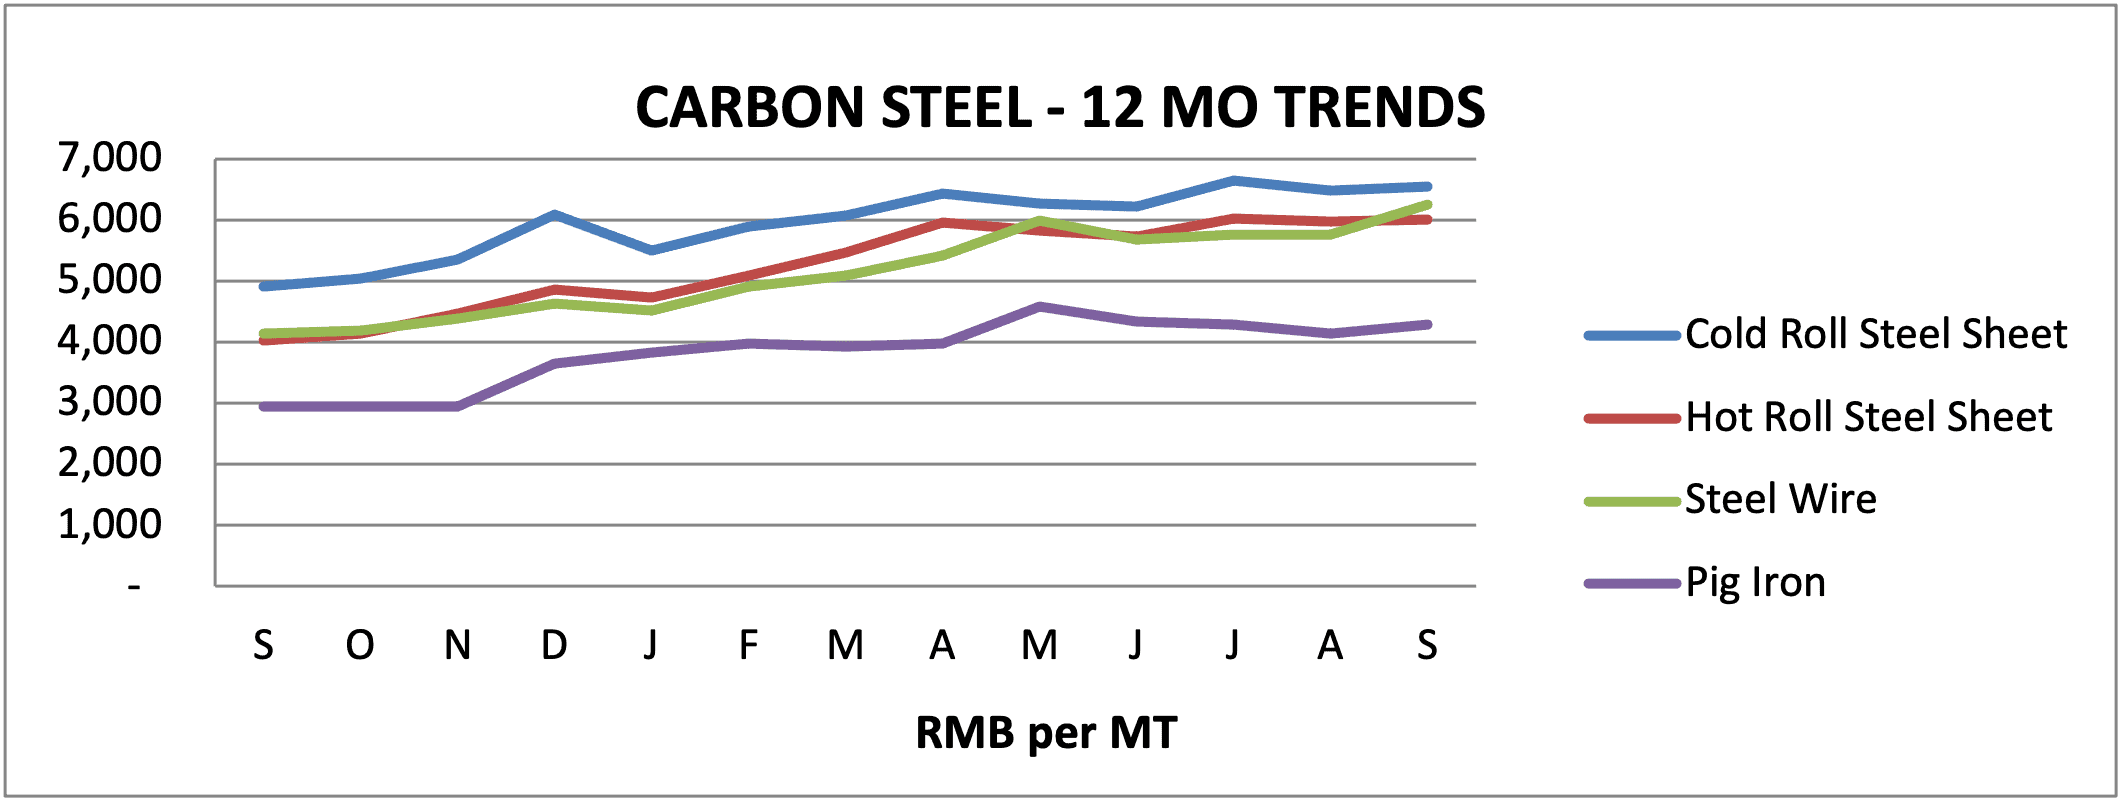
For Q3, the prices of all Carbon Steel were up on average 6% versus Q2, however pig iron prices stabilized down a little over 1%. Year over year, all carbon steel including plates, rods, and wire are up significantly on average over 4o% versus one year ago with Pig Iron up 45%.
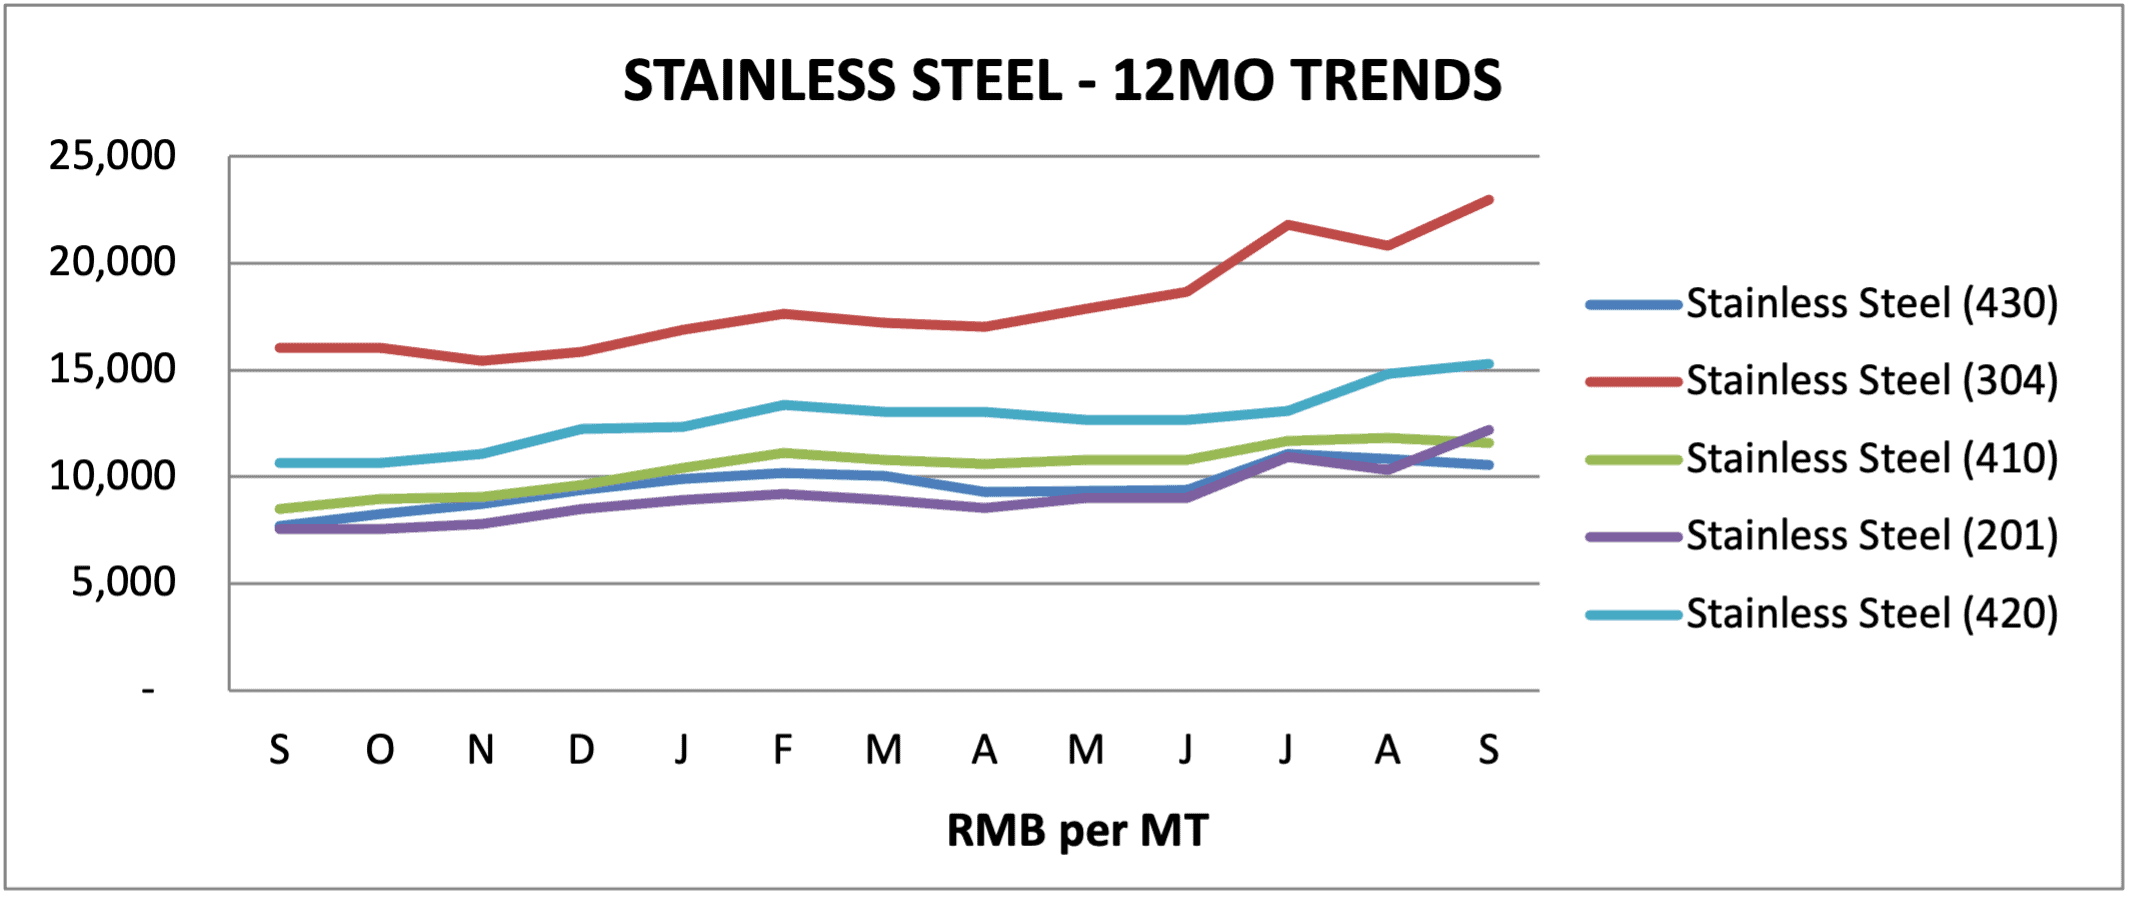
Stainless Steel grades are also up on average by 19% versus Q2. Year over year, it’s the same story as carbon steel grades up 35% to 50% on average across the board.
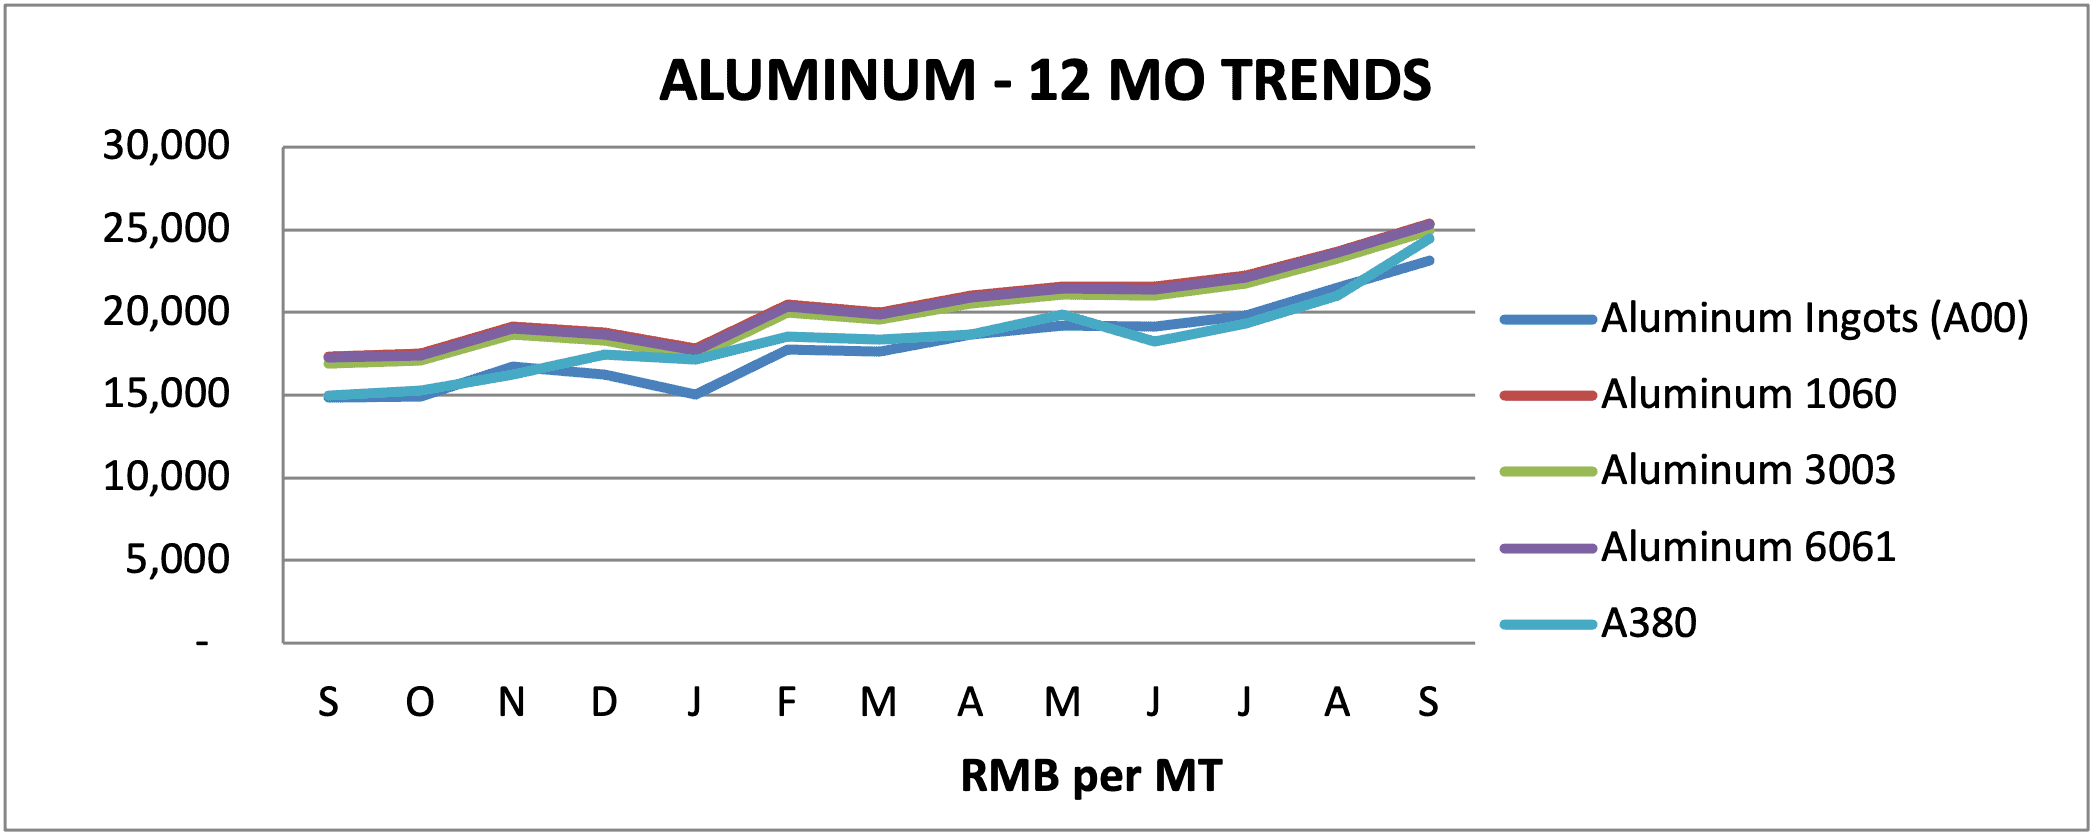
Aluminum prices slowed in September but still increased on average 21% versus Q2. Year over year, all aluminum prices are up significantly versus year ago prices on average up over 50% with ingots up 56%.
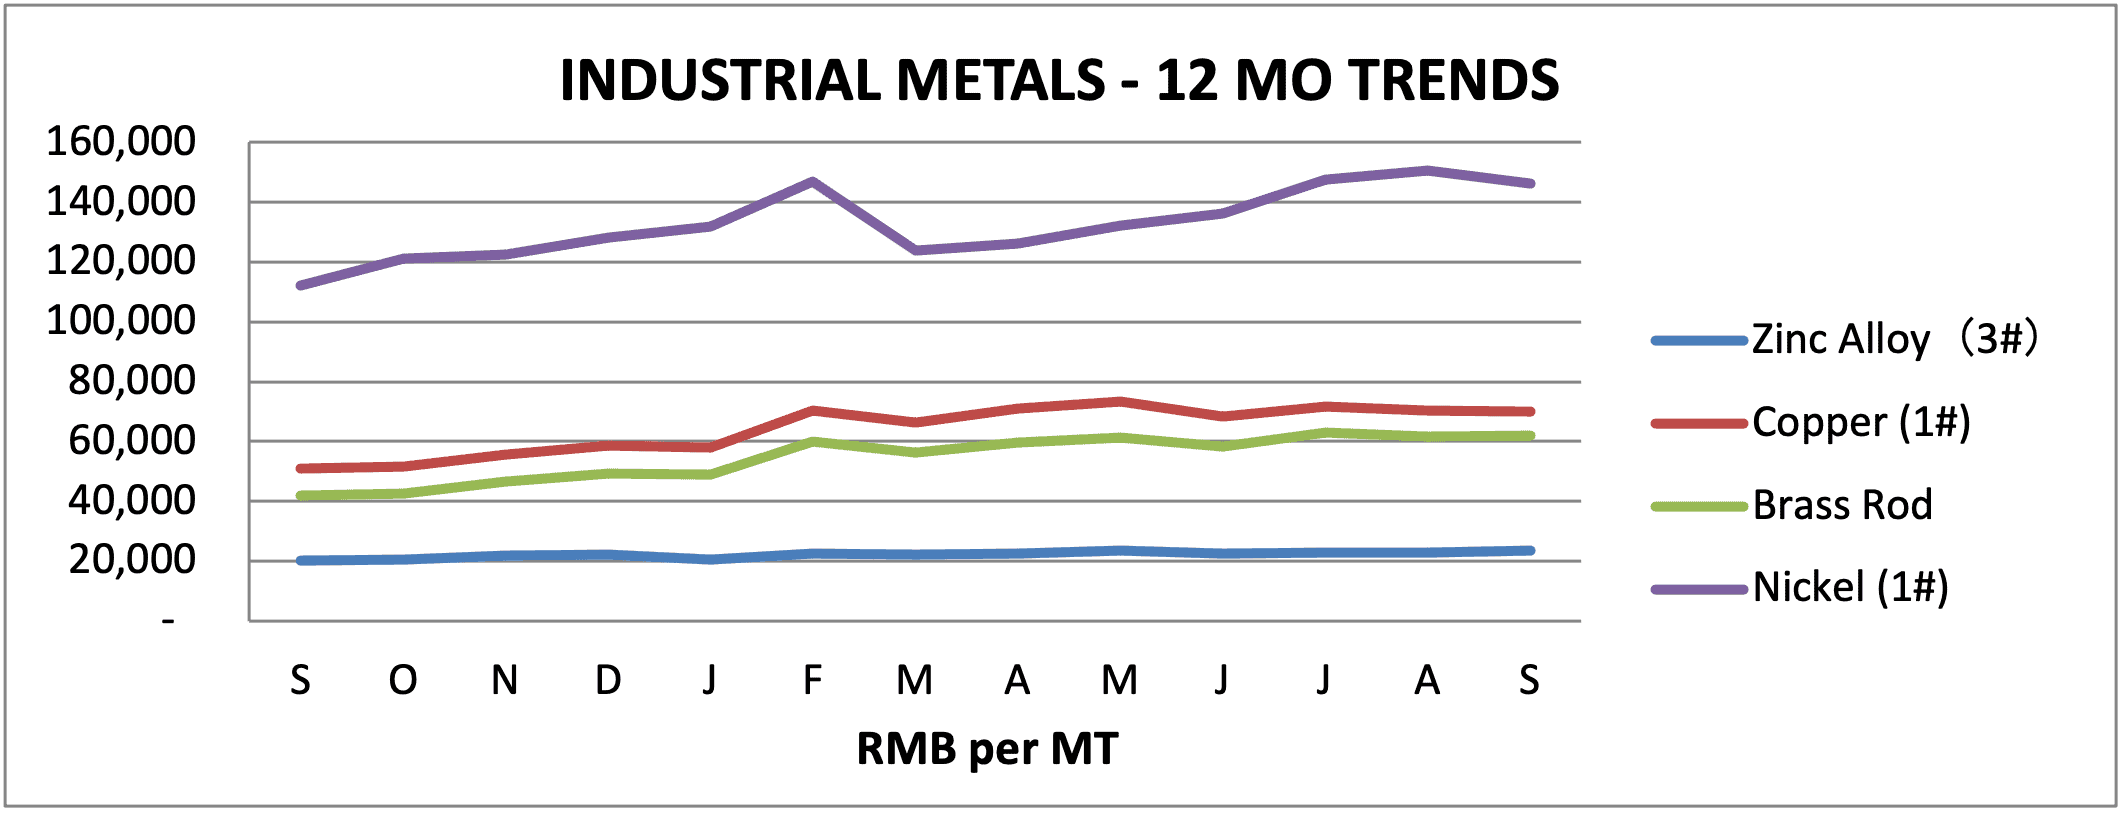
Other Industrial Metals also ticked upward in Q3 on average by about 4%-5%. Year over year, Copper leads the way up 48%, followed by Brass Rod up 37%, Nickle up 30%, Brass tube up 19%, and Zinc Alloy up almost 17%.
WOOD, PAPER & TEXTILES
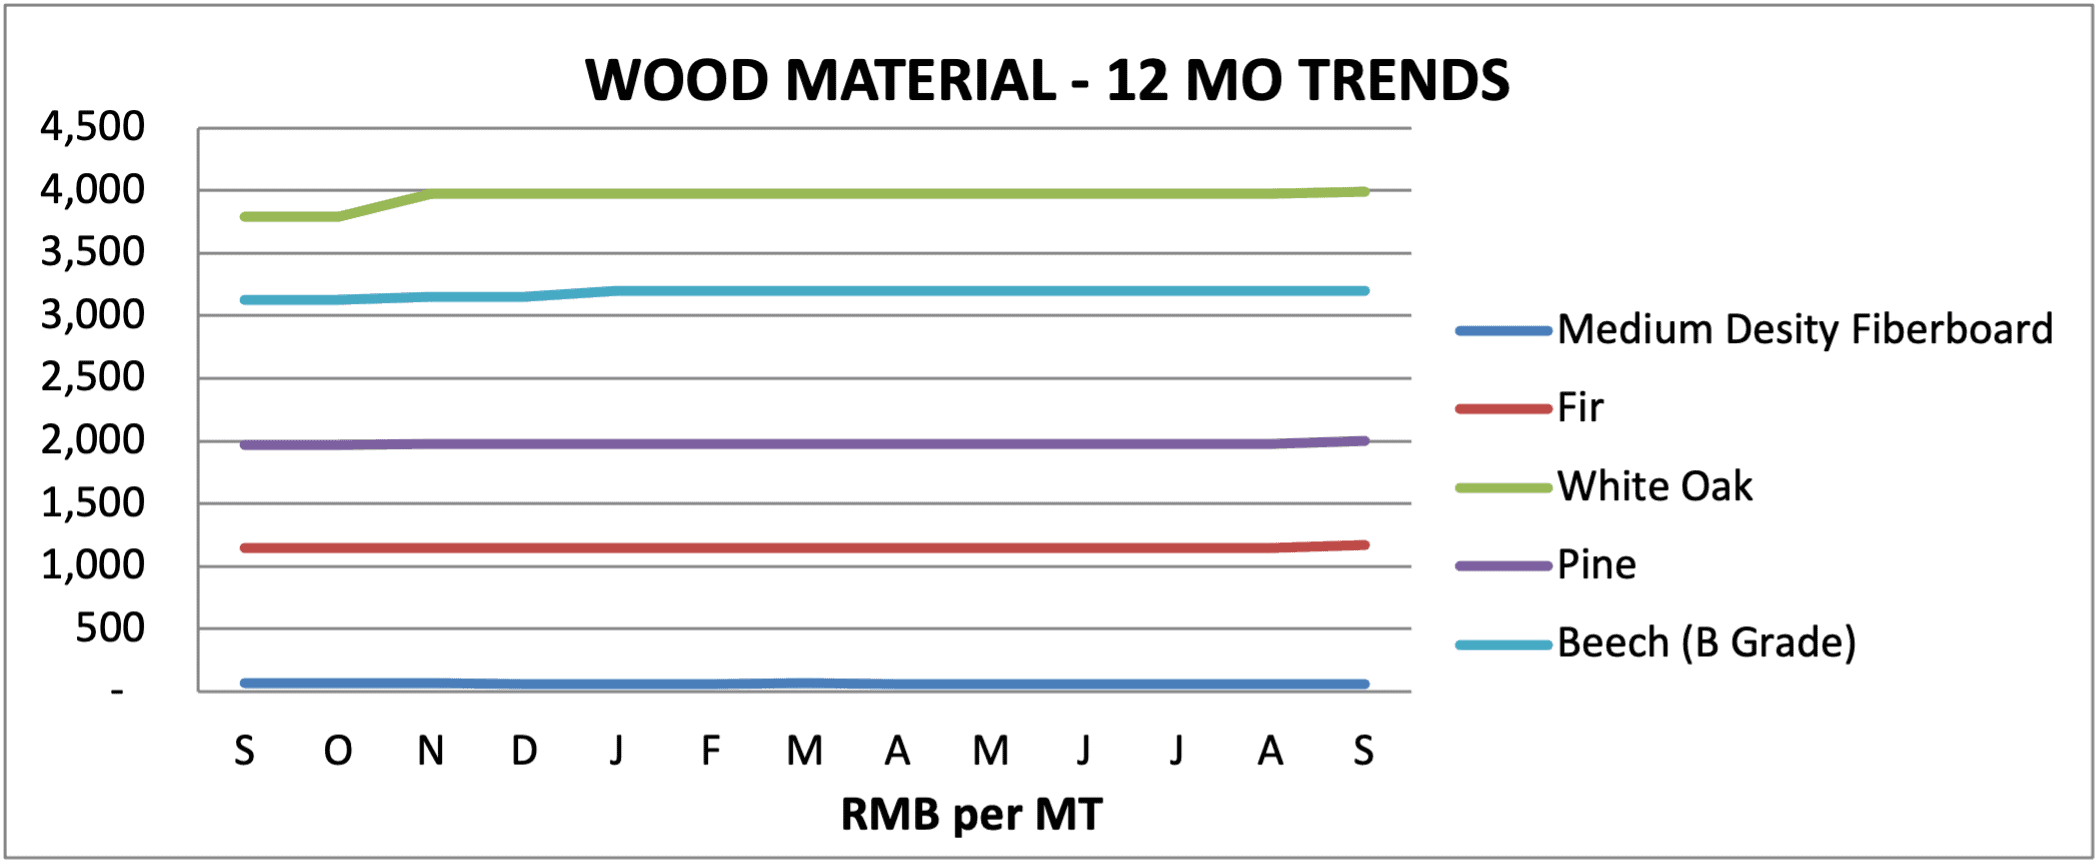
Wood prices showed small increases in Q3 versus other commodities rising on average by 3% to 5%. Year over year, all wood grades are up about 3% except MDF down on average by 6% to 10% versus one year ago.
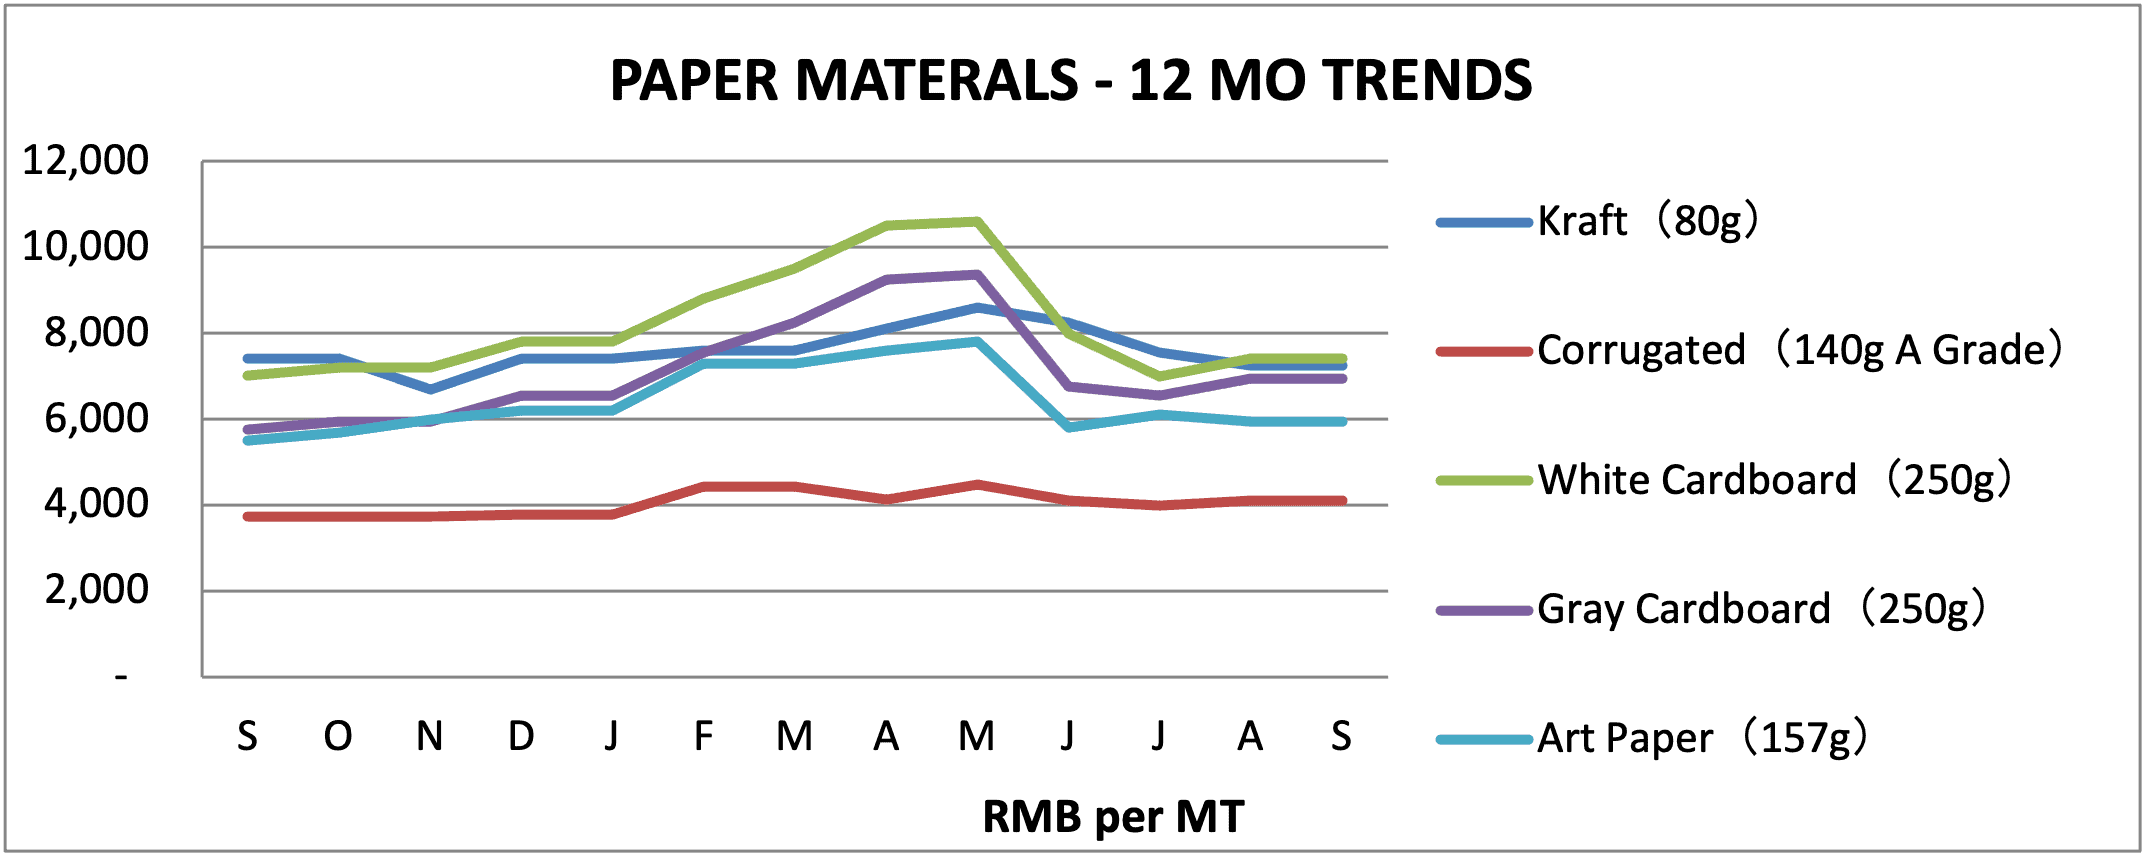
Paper materials held steady in Q3 with cardboard and art paper up slightly and corrugated and Kraft down on average about 8%. Year over year, Paper prices are up on average about 15% although Kraft paper remains the exception down a few percent.
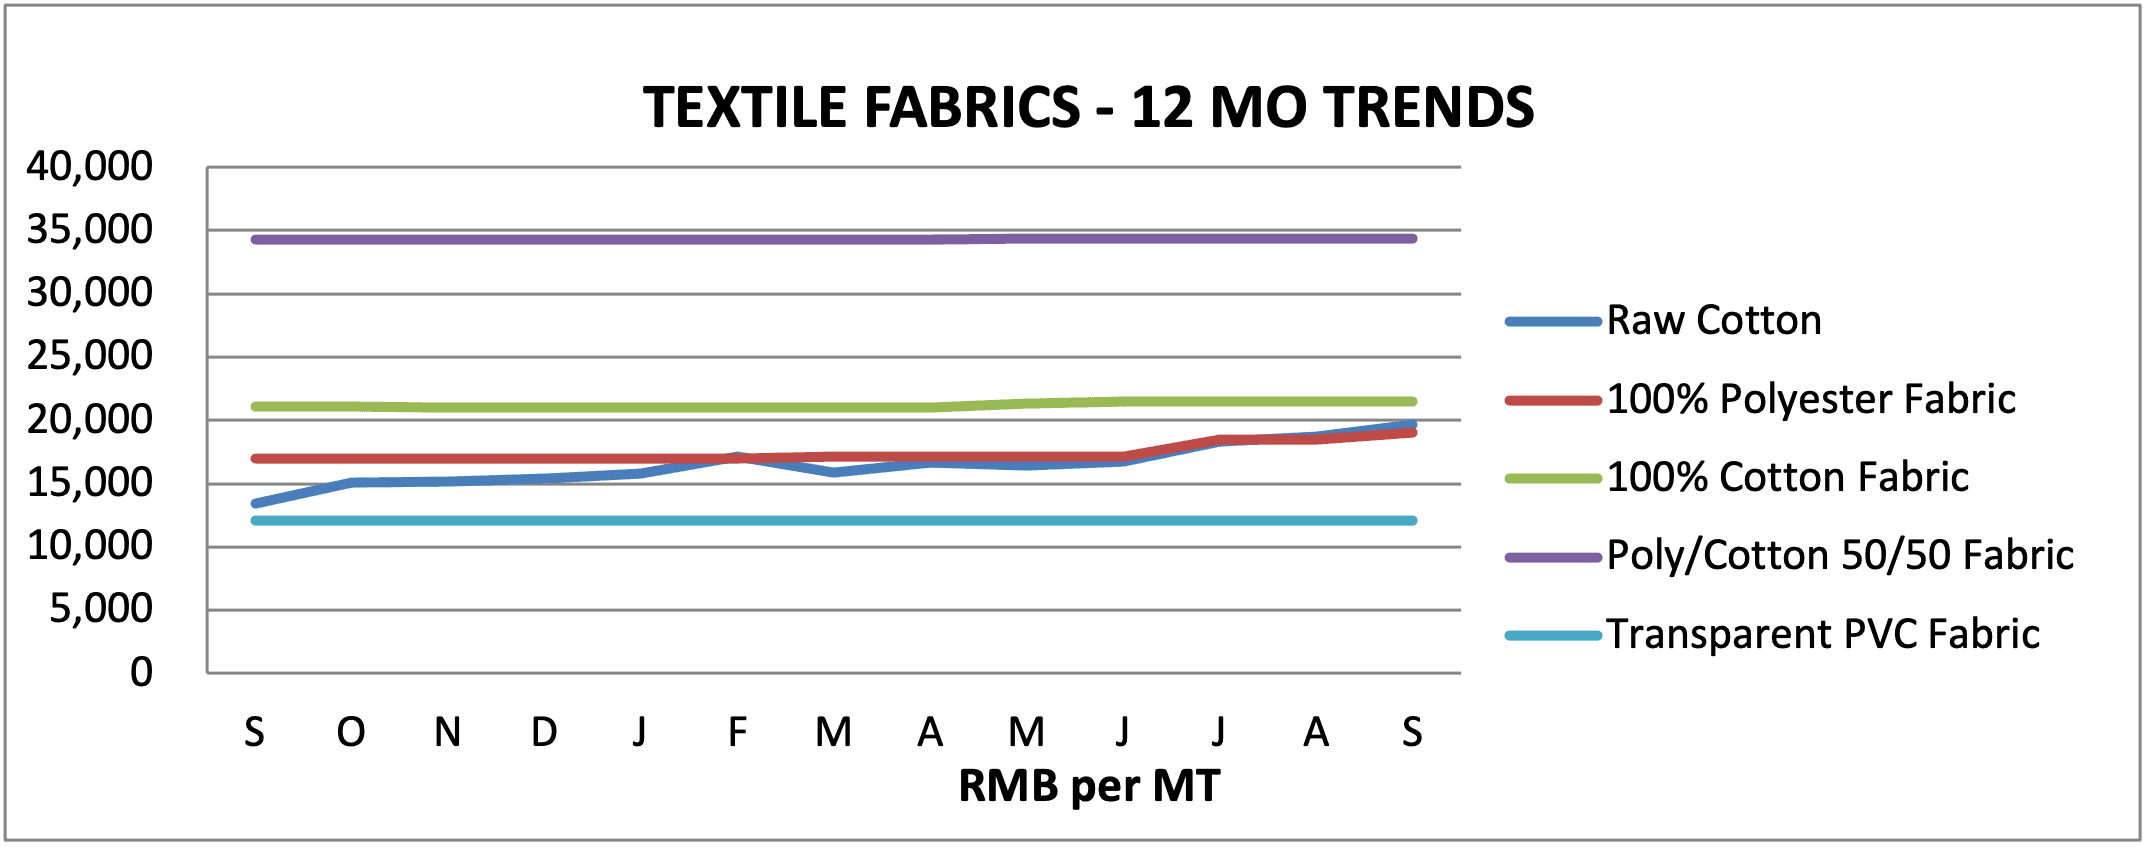
Textile fabric prices were mostly unchanged in the third quarter, except Raw Cotton which rose about 17% and Polyester up 11% versus Q2. Year over year, Raw Cotton is up 46%, Polyester Fabric up 20% on average versus one year ago.
CERAMIC AND GLASS RAW MATERIAL
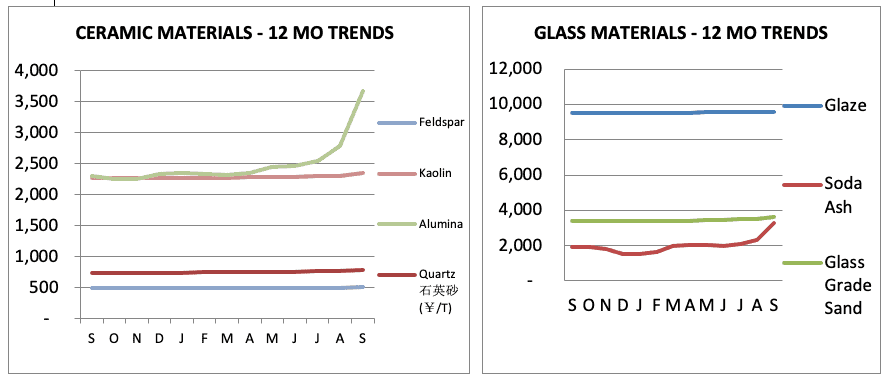
Ceramic and Glass Raw Materials, most of the materials were up about 3%, however, steady Soda Ash shot up 65% and Alumina was up 49%. Year over year, Soda Ash is up over 73%, Alumina is up 59%, Quartz and Sand up almost 7%, and Kaolin and Feldspar up less at 4% and 1% respectively versus one year ago.
FUEL, FREIGHT, LABOR, AND MORE
FUEL
Fuel prices saw continued upward pressure up on average by almost 25% in Q3 versus Q2. Year over year, prices have almost doubled for most fuels. The cost for Industrial electricity has not been raised however it has begun to be rationed in some areas and rumors of price hikes are active with coal imports rising and domestic stockpiles going down as we head into the winter months.
OCEAN FREIGHT
The World Container Index was up 46.02% in Q3 versus Q2 and year over year containers cost 3 to 4 times what they did just one year ago. Capacity continues to be booked three to four weeks out and imported freight arrives to congested US ports and overloaded rail yards driven by replenishment orders for retailers. Industry analysts are stimating that the constraints on capacity and inflated prices will continue to be felt well into 2022 as the market deals with the continued surge of demand and backlogs.
COST OF LABOR
Most of the Asian labor rates were unchanged in Q3. Year over year, India and Indonesia were up the most at 12%, 3% respectively.
CURRENCY EXCHANGE RATE
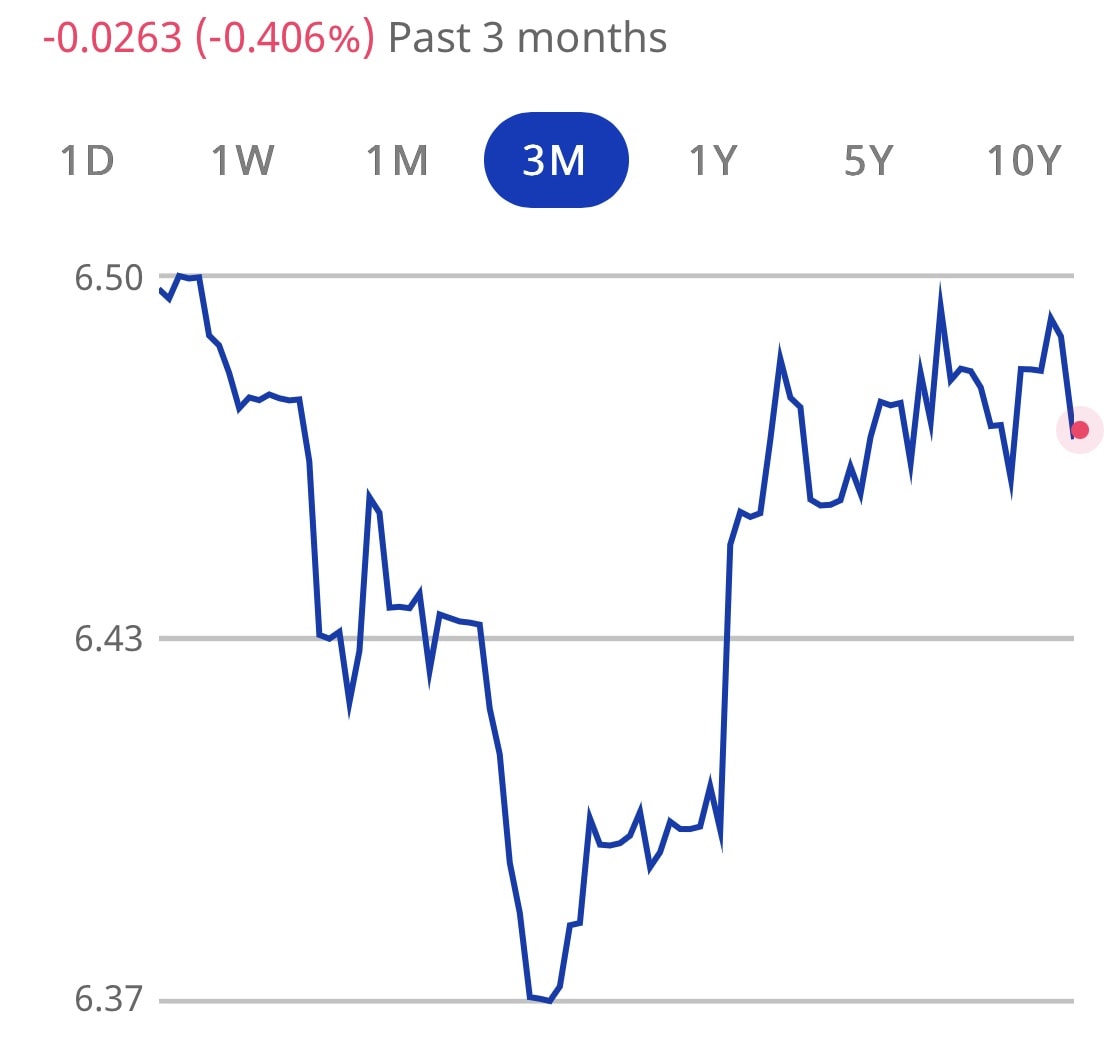
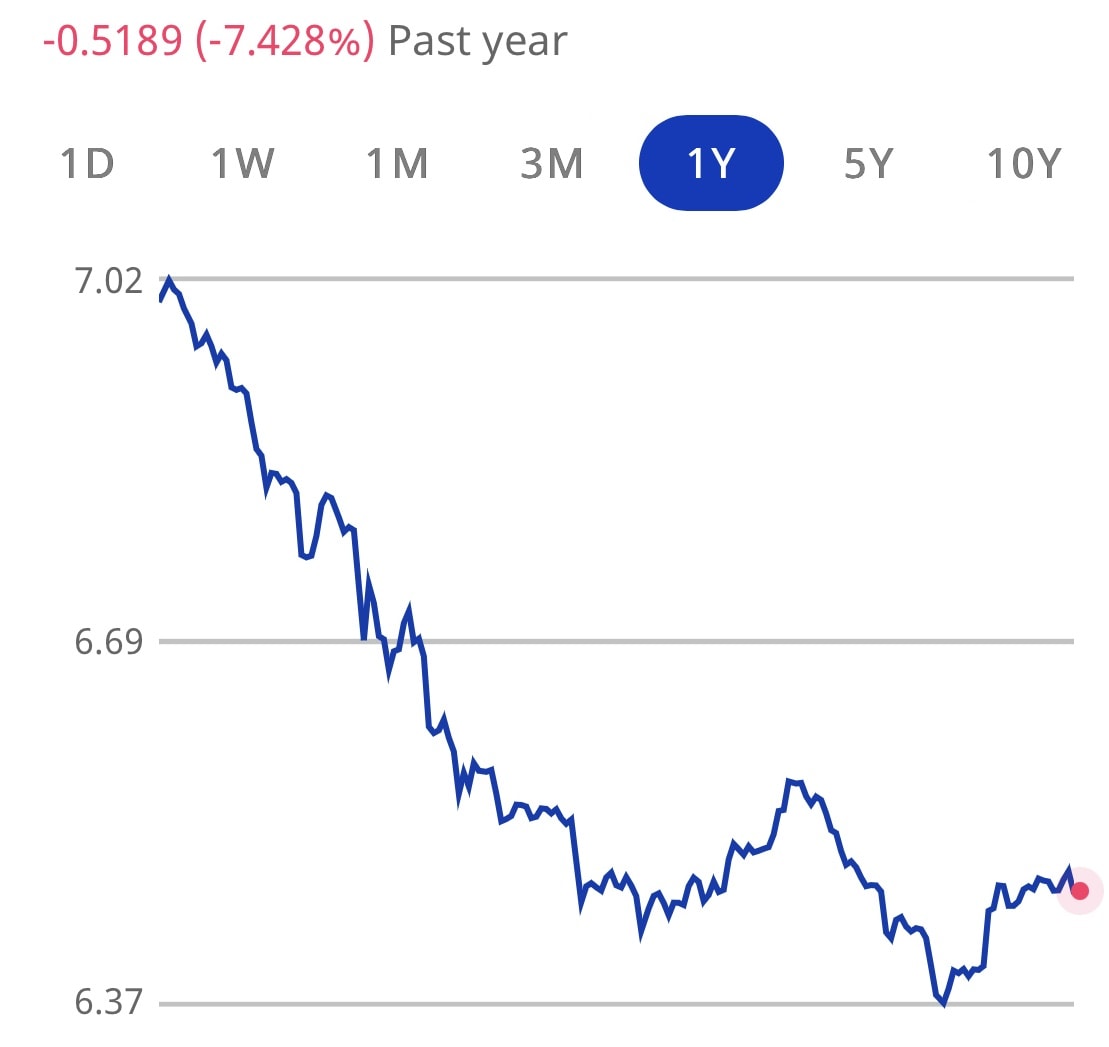
For the fourth quarter, the USD was 1.&% stronger against CNY and slightly weaker against the Vietnam Dong versus last quarter. Year over year, the USD stronger against CNY by 2.2% and stronger against the Vietnam Dong by 1.7% while weaker by 11.5% against the Thai Baht.
CHINA TRADE
China Imports were down 3.0% in Q$ versus Q3 and China Exports were down 11.7%. Year over year, China Imports increased 20.73% and Exports increased 20.78% versus one year ago. The China Consumer Price Index (CPI) was down 0.8% and the China Producer Price Index (PPI) decreased 3% in Q4 versus Q3. Year over year, the China CPI was up 1.3% and China PPI was up 10.7% versus one year ago.
PURCHASING MANAGERS INDEX (PMI)
The PMI China Purchasing Managers’ Index came in at 50.9, rising from November’s reading of 49.9 showing an acceleration in growth of Chinese factory activity that month and the US PMI moved down from 61.1 in November to 58.7 in December. The 50-point mark in PMI readings separates growth from contraction. PMI readings are sequential and represent month-on-month expansion or contraction.
COVID UPDATE – VIETNAM
While Asia Manufacturing Stalled in Q3 – 2021, Vietnam has suffered the worst, with COVID-19 cases surging and lockdowns putting severe constraints on business activity. Many factories are shut down or operating at severely reduced capacities. QIMA reported that their inspection and audit volumes in Vietnam shows a contraction in every month of Q3 and that compared to pre-pandemic 2019, inspection and audit demand in Vietnam contracted over 30% in Q3 2021. While not the only country in Southeast Asia to be suffering from surges in COVID, Vietnam has been affected more than most, with neighboring countires such as Cambodia being the beneficiaries.
A very good analysis of current Asia Manufacturing Trends this quarter was published by Reuters recently and can be found at this link.
CONTACT US FOR MORE INFORMATION
Thank you for taking the time to follow trends in Asia manufacturing. Source International has operational offices in the USA, China, and Vietnam. Our passion is to partner with companies in supply management from Asia. We have a three-decade track record of on the ground operations in Asia, a rigorous, agile operating system, and a very well-trained local staff. We welcome the opportunity to show you how we can add value to your supply chain in Asia and invite you to visit our operations in USA and Asia to learn more. For additional details, please contact our team.



Comments are closed