Asia Manufacturing Costs Moderated in Q4-2021
Asia Manufacturing Costs Moderated in Q4-2021
Q4 EXECUTIVE SUMMARY
After a promising first half of the year, the second half of 2021 proved lackluster for Asia manufacturing. Costs in Q4, 2021 moderated on lower demand and work interruptions caused by COVID outbreaks. These factors coupled with shortages of key semiconductor chips and power restrictions in China led to a decline in production capacity utilization.
The commodity price trends in the fourth quarter showed downward movements in some key materials reversing increases seen in the past few quarters. Most grades of steel, aluminum, plastics, other metals, ceramic raw materials, and fuel all showed price decreases while only rubber, paper, textiles, and other metals all increased slightly. Textiles, and labor costs meanwhile were mostly flat in price. Shippers breathed a sigh of relief in Q4 as the World Container Index declined by 10.4% in Q4 reversing the nearly year-long trend of increasing freight rates. China exports remained strong showing 11.4% increase versus Q3 and economic data showed the world’s second largest economy grew faster than expected between October and December. Numbers from China’s National Bureau of Statistics showed the Chinese economy grew by 8.1% in 2021, slightly below the market’s expectation for around 8.4% growth for the year. China’s producer prices dropped 2.3% from November to December 2021.
Numbers from China’s National Bureau of Statistics showed the Chinese economy grew by 8.1% in 2021, slightly below the market’s expectation for around 8.4% growth for the year. In the fourth quarter, China’s GDP rose 4% from a year ago, topping a Reuters poll that predicted a 3.6% increase. Industrial production also rose and beat expectations, but retail sales had a more muted growth.
The outlook for Asia manufacturing production in the first half of 2022 looks promising with strong demand continuing but with some uncertainty over the direction of new Covid outbreaks, power availability, increased fuel costs, and overall inflationary pressures.
For all the details please see the entire report that follows:
Asia Manufacturing Costs Moderated in Q4-2021
PLASTIC RESINS & RUBBER
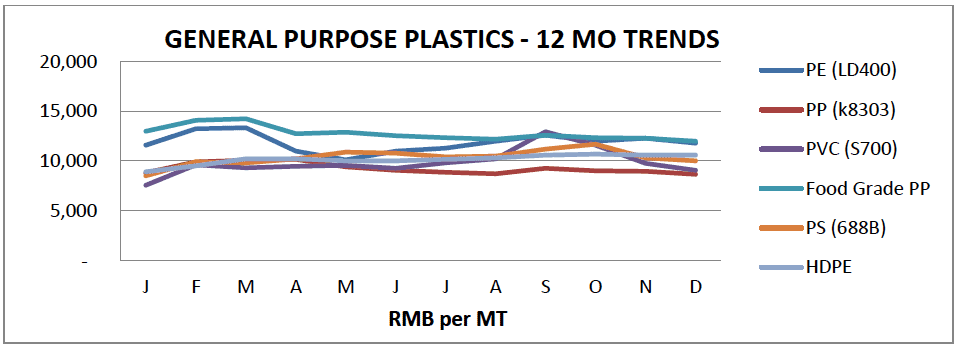
Most general purpose plastic prices moved lower in the 4th quarter of 2021 on average by around 5%-8% vs Q3. PVC rise declined the most at 30.1%, followed by PS, PE, and PP, down 10.7%, 6.3%, and 5.7%. TPE, EVA, HDPE, and PET were either flat or down marginally. Year over year, price changes are mixed, with some plastic prices up and some down. At both extremes are EVA up in price 28.3%PE and HDPE up 16.5% while PP was down on average by 6.5%
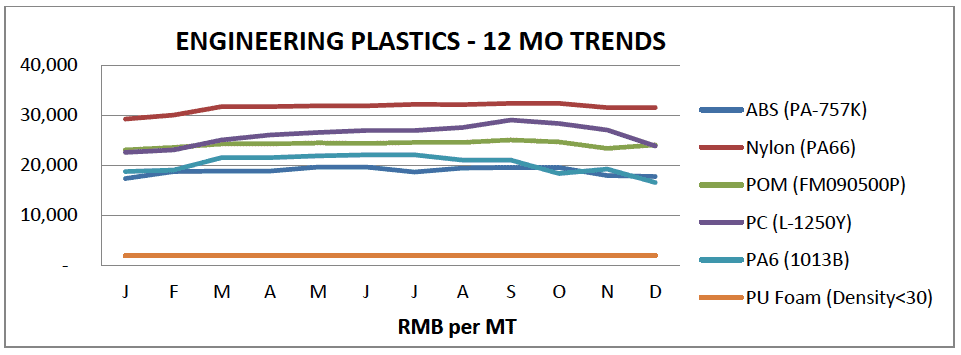
The engineering grade plastic prices were also down in Q4 on average by over 10%. Nylon-PA6 led down by 21.4% followed closely by PC down 17.9%, and ABS down 9.2% in price versus Q3. Year over year, prices were mixed with ABS down 3.3%, Nylon-PA66 up 5.9%, PC up 3.5%, Nylon-PA6down 11.3%, PU Foam and POM were mostly flat.
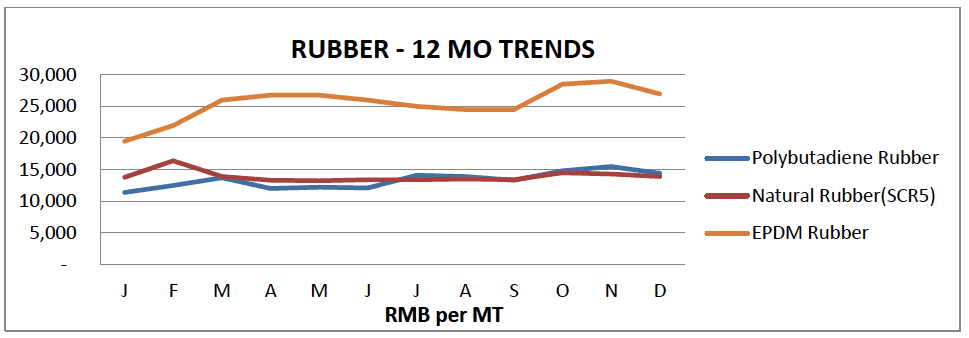
Rubber prices bucked the trend with most grades higher in price except for silicon which moved sharply lower. Q4 versus Q3 saw Polybutadiene Rubber up 8.3%, Natural Rubber up 3.7%, Latex up 7.9%, and EPDM Rubber up 10.2%. Only silicon declined in price however by almost 30% after rising all year. Year over year, Polybutadiene Rubber was up 37.1%, Natural Rubber up 4.5%, NBR up 18.5%, Neoprene up 22.8%, and EPDM Rubber up a whopping 56.1%.
STEEL, ALUMINUM, AND OTHER INDUSTRIAL METALS
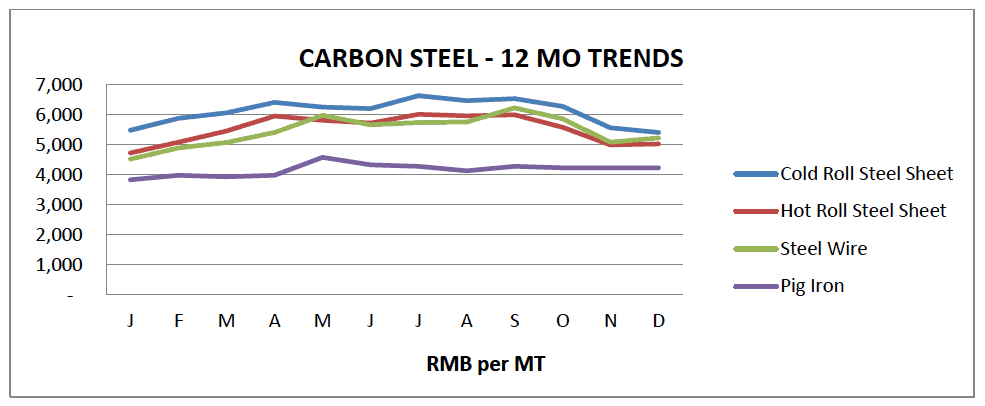
The fourth quarter of 2021 saw steel prices finally ease and moved lower for all grades. Carbon Steel was down on average by 11.9% versus last quarter. Cold Roll Steel Sheet was down 17.3%, Hot Rolled Steel Plate was down 16.2%, and Steel Wire was down 16.2%. Raw material Pig Iron was down 1.2% versus last quarter. Year over year, most carbon steels remain much higher than a year ago prices, up on average 8%- 10%.
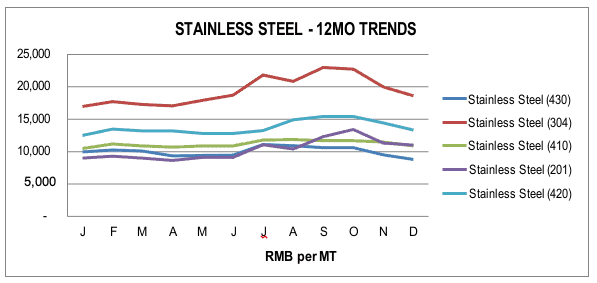
Stainless Steel grades prices also improved, down sharply on average by 12.9versus Q3. Year over year, most grades were up on average by 10%-20%, with 304 up 17.0%, 410 up 12.5%, 201 up 28.2%, and 420 up 7.8%. 430 grade material, however, bucked the trend and moved down in price by 6.9%, versus one year ago.
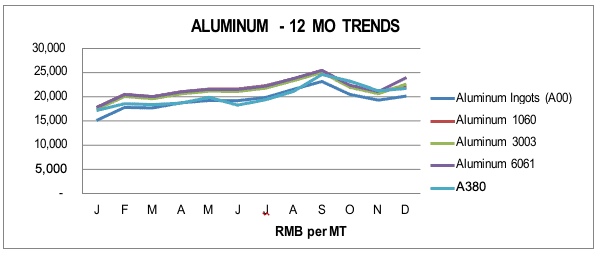
Aluminum prices in Q4, 2021 were down 10%-15% on average with 1060 down 12.4%, 6061 down 5.8%, and 3003 down 9.6%. Year over year, all aluminum prices show sizable increases averaging almost 25% versus one year ago. A00 was up 23.7%, 1060 was up 18.3%, 3003 was up 23.2%, 6061 was up 27.6% and A380 was up 24.2%.
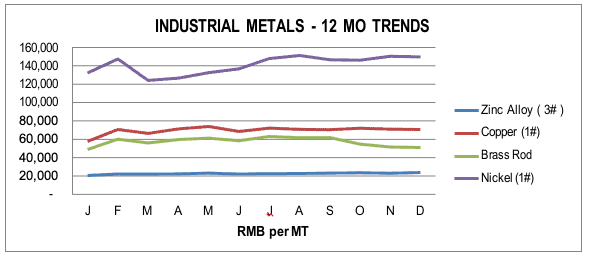
In other Industrial Metals, the trend was mix in Q4. Brass, Nickle, and Zinc all continues their upward movement in price, while Copper went down in price by 17.4%. Year over year, Zinc Alloy increased 9.4%, Copper increased 20.0%, Brass rod increased 3.4%, and Nickel increased 16.3%.
WOOD, PAPER & TEXTILES
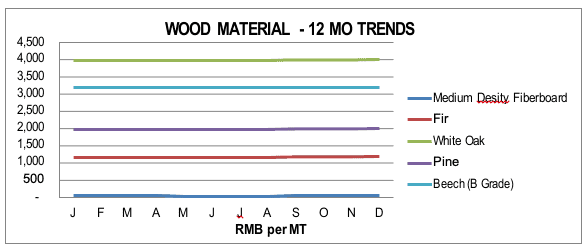
Wood prices were mostly flat in Q4 of 2021. Year over year, MDF was up 6.1%, Fir was up 2.6%, White Oak was up 0.8%, Pine was up 1.5%, and Beech was up 1.6% versus one year ago.
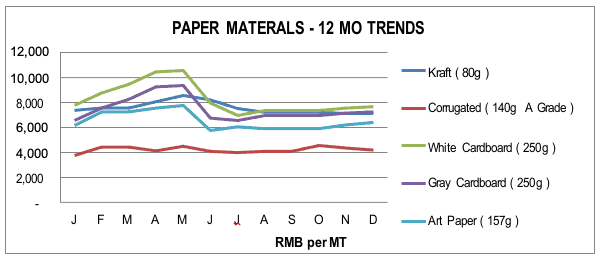
Paper products price trends continued their upward movement in Q4 with cardboard up 4.2% on average and Corrugated board up 2.4%. Year over year, Kraft and White Cardboard were down 3.4% and 1.4%, respectively while Corrugated was up 11.11%, Gray Cardboard was up 10.5% and Art Paper was up 4.0% versus one year ago.
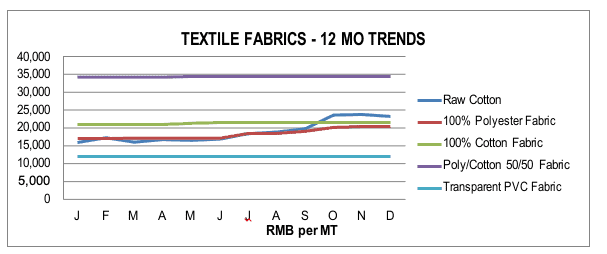
Textile fabric prices were mostly unchanged in Q4, except Raw Cotton in price was up 17.8% and 100% Polyester Fabric was up 7.35%. Year over year, Nonwoven PP and T/C were unchanged while Raw Cotton was up 50.2% and 100% Polyester Fabric was up 20.3%, and 100% Cotton Fabric was up 2.4% versus one year ago.
CERAMIC AND GLASS RAW MATERIAL
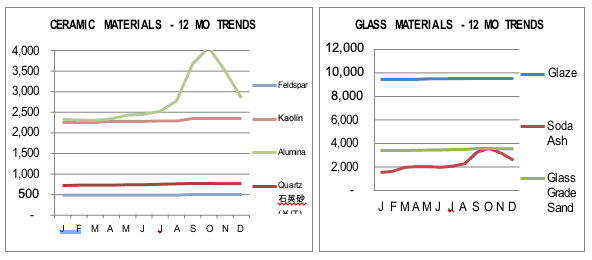
Ceramic and Glass raw material prices improved in Q4 with Alumina down 22.2%, and Sooda Ash down 21.2% after climbing all year. Year over year, Soda Ash led increases up 67.7%, Alumina followed up 22.2%, Quartz was up 6.1%, Glass Grade Sand was up 5.6%, and Kaolin was up 3.5% versus one year ago.
FUEL, FREIGHT, LABOR, AND MORE
FUEL
Fuel prices in China improved slighting in Q$ and were down on average 4.9, with Diesel up 7.2%, and Petroleum down 2.4%, Natural Gas down 2.3% and LPG Gas down 0.6%.%. Year over year, all grades were up in price on average over 20% versus one year ago. The cost for Industrial electricity has not been raised however shortages and rationing have been reported.
OCEAN FREIGHT
The World Container Index was down 10.4% versus Q3, 2021. Year over year, the World Container Index was up 119% though versus one year ago reflecting the continued high cost of ocean freght. An average 40′ container from Shanghai to Los Angeles has settled back to a range of $10,000-$15,000.
COST OF LABOR
Most of the Asian labor rates were unchanged in Q4. Year over year, Labor costs in Shandong and Tianjin China were up by 10% and 6.34% respectively and India was up 1.61%.
CURRENCY EXCHANGE RATE
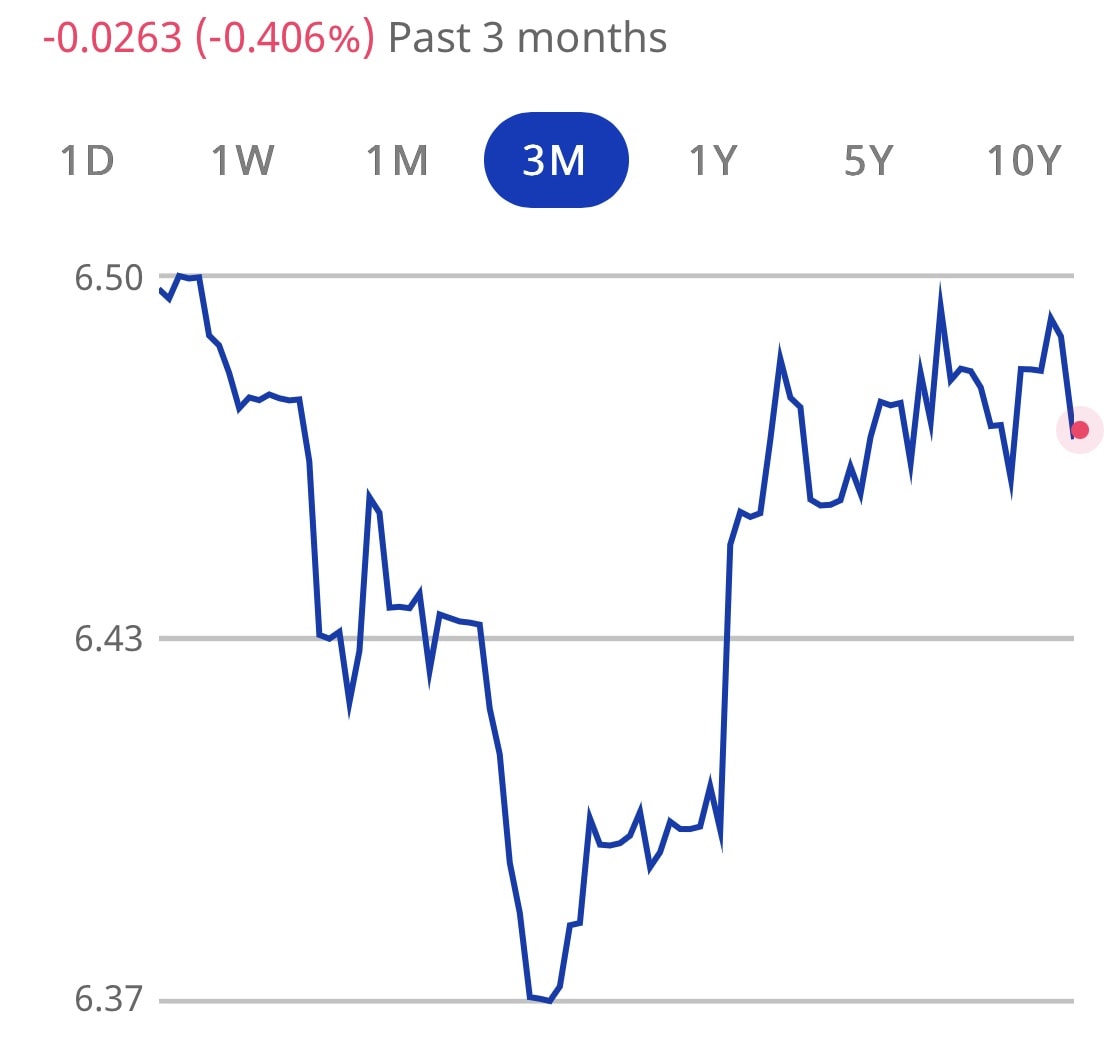
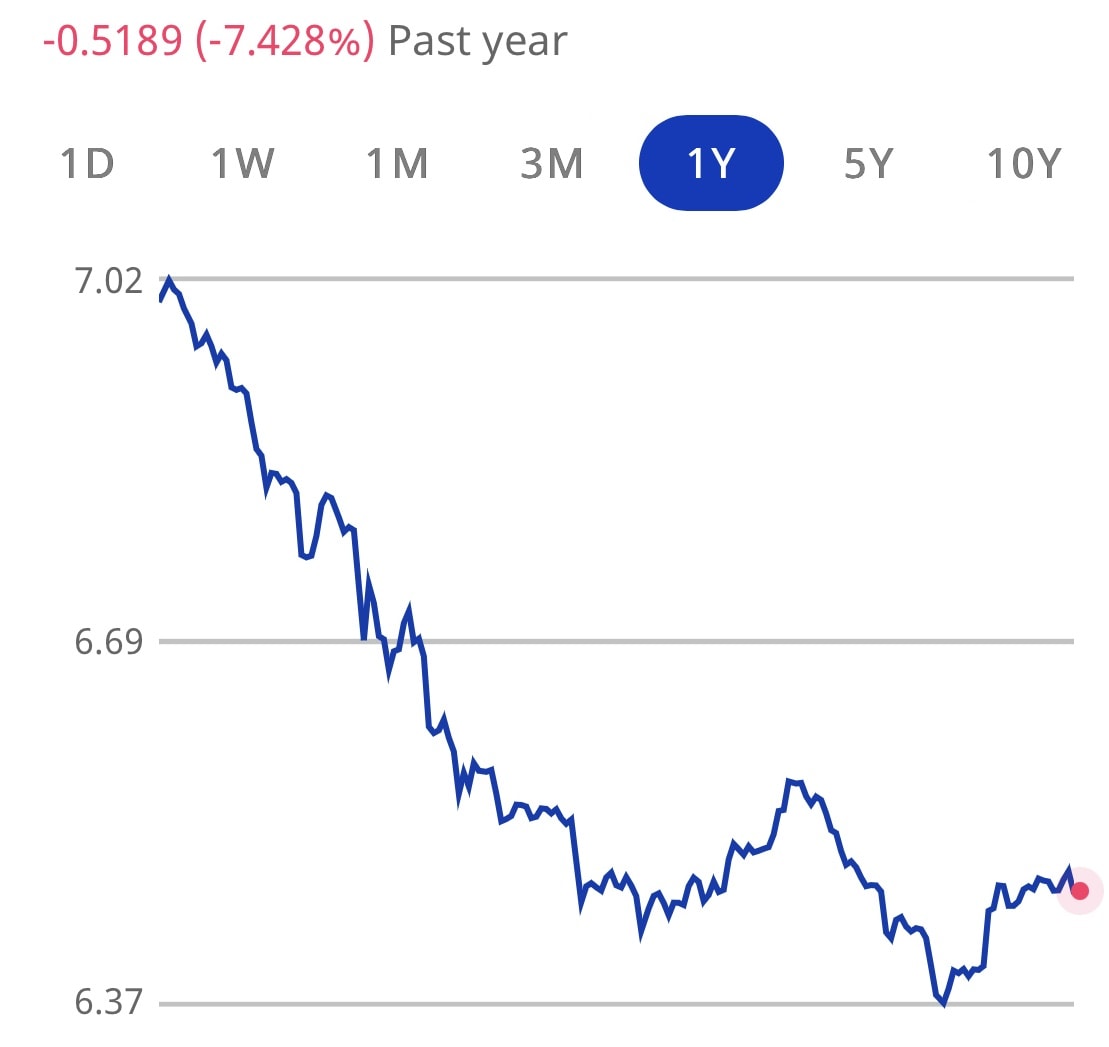
For the fourth quarter, the USD was 1.&% stronger against CNY and slightly weaker against the Vietnam Dong versus last quarter. Year over year, the USD stronger against CNY by 2.2% and stronger against the Vietnam Dong by 1.7% while weaker by 11.5% against the Thai Baht.
CHINA TRADE
China Imports were down 3.0% in Q$ versus Q3 and China Exports were down 11.7%. Year over year, China Imports increased 20.73% and Exports increased 20.78% versus one year ago. The China Consumer Price Index (CPI) was down 0.8% and the China Producer Price Index (PPI) decreased 3% in Q4 versus Q3. Year over year, the China CPI was up 1.3% and China PPI was up 10.7% versus one year ago.
PURCHASING MANAGERS INDEX (PMI)
The PMI China Purchasing Managers’ Index came in at 50.9, rising from November’s reading of 49.9 showing an acceleration in growth of Chinese factory activity that month and the US PMI moved down from 61.1 in November to 58.7 in December. The 50-point mark in PMI readings separates growth from contraction. PMI readings are sequential and represent month-on-month expansion or contraction.
COVID UPDATE – CHINA & VIETNAM
Since the outbreak of COVID-19 in early 2020, China has imposed a strict “zero Covid” policy to prevent the spread of the virus and keep cases as close to zero as possiblE. The recent Delta and Omicron outbreaks have caused the China government to double down on prevention measures, including reducing the number of international flight routes, increasing the length of quarantines on arrival, and adding additional domestic prevention measures. For all practical purposes, foreigners continue to be barred from entry.
Vietnam continues to struggle with COVID-19 cases in all provinces. A complete article on the situation there is at this link. Vietnam has suspended the entry of all foreigners since March 22, 2020, until further notice to limit the spread of COVID-19.
CONTACT US FOR MORE INFORMATION
Thank you for taking the time to follow the trends that drive costs in Asia manufacturing. Source International has operational offices in Louisville, Kentucky; Xiamen, China; and Ho Chi Minh, Vietnam.
Our passion is to partner with companies in supply management from Asia. We have a three decade on-the-ground track record, a rigorous operating procedure, and a very well-trained local staff. We welcome the opportunity to show you how we can add value to your supply chain in Asia and invite you to visit our offices and website to learn more about us.
For additional details, please refer to the charts that follow or contact one of our Operations Specialists for more information. Thank you for your support.
Visit our :www.sourceint.com


