Asia Manufacturing Showed Signs of Improvement in Q4-2022

ASIA MANUFACTURING COST DRIVERS REPORT
Q4– 2022 (Oct. Nov. Dec.)
Tracking The Trends Which Drive Costs in Asia Manufacturing
Executive Summary
Despite supply headwinds, labor shortages, and an uncertain economic environment, Asia manufacturing continues to surpass the expectations of recent years. Manufacturing has demonstrated continued strength in 2022, building on the momentum it gained emerging from the pandemic, and surpassing expectations from the prior two years. While overall demand and production capacity have hit recent highs, there are indications that the near-term outlook may not be as bright. Asia industry is currently experiencing concerns related to inflation and economic uncertainty. In addition, manufacturers continue to grapple with talent challenges that may limit their growth momentum. Moreover, supply chain issues including sourcing bottlenecks, global logistics backlogs, cost pressures, and cyberattacks will likely remain critical challenges in 2023. As leaders look beyond leading amid disruption and revamp their approach, our 2023 manufacturing industry outlook examines five important trends to consider for manufacturing playbooks in the year ahead.
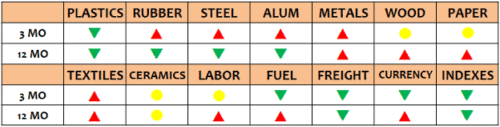
The commodity price trends in the fourth quarter were mixed with plastics, fuel, freight and currency leading the down-in-price group, while rubber, steel, aluminum, other metals, and textiles led the up-in-price group. Meanwhile paper, ceramic materials, and labor costs showed little change. Year over year, plastics, rubber, steel, aluminum, and freight ended the year lower in price than one year ago while metal, wood, paper, textiles, labor, and fuel all saw price increases in the period.
Below is a chart of the overall trends. For all the details, please see the entire report below or download it from the link at the end.
Report Details
PLASTICS & RUBBER
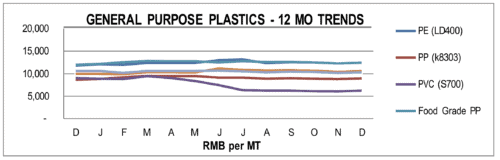
Overall, the General-Purpose plastic resin prices declined in Q4 of 2022 vs Q3 but only slightly. And, in the most recent month of December the trend appears to have reserved with some price increases. Year over year, the results are mixed with PVC, HIPS, HDPE, and PET all showing price declines from 3% to 30%, while EVA, PS, PE and PE all showing increase of 4% to 11% versus one year ago.
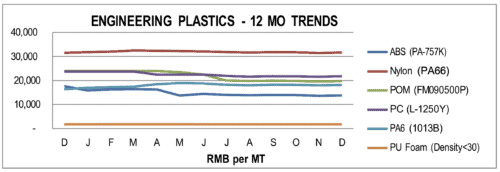
Engineering grade resins displayed a similar trend in Q4 to the General-Purpose grades, with all grades except PU Foam showing price declines, however, they declined less than GP, most less than 1%. Year over year, prices were down on average by 4.5%, led by ABS down 21.8% and POM down17.5% while Nylon increased by 10.3% and Triton and Nylon prices increased slightly, by only about 1% versus 1 year ago.
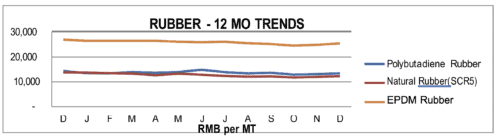
Rubber prices were more mixed in Q4 with the trend generally up on average by about 1.9%. Reclaimed Rubber led the way up 2.6% while Polybutadiene Rubber led the decliners down 2.2%. Year over year, the trends were more mixed, with Neoprene and Nitrile up the most, 27.4% and 18.4% respectively, while Silicon, Natural Rubber, and Latex all showed substantial price declines of 35.7%, 11.5%, and 10.2% respectively versus one year ago.
METALS
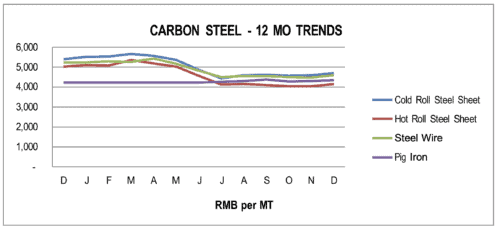
For the fourth quarter of 2022, the prices for most of Carbon Steel grades were up slightly on average about 1% or less versus three months ago with Cold Roll Steel Sheet up the most at 1.7%. Year over year, virtually all carbon steel prices were down on the average 8.6% versus one year ago.
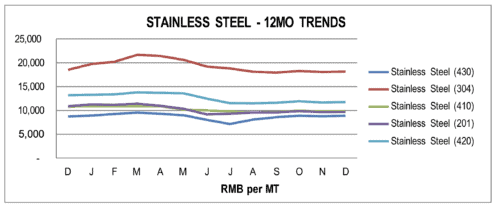
Stainless Steel prices were also up slightly in Q4, on average by 1%-2% compared with last quarter. Year over year, prices were mostly lower than 2021 with 430 and 201 grades down the most on average about 10% versus one year ago
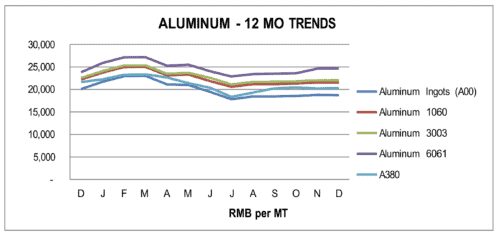
Aluminum prices were higher in Q4, on average by 1%-2%, except 6061 which was up over 5%. Year over year, aluminum prices decreased on the average by 3.2%, however, 6061grade was up 3.6% versus one year ago.
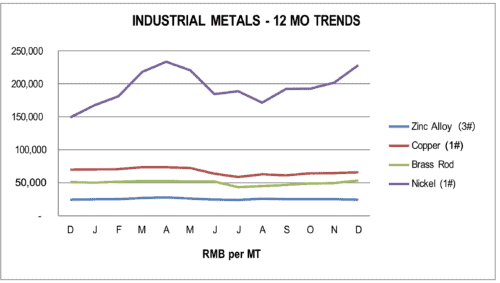
In other Industrial Metals, all showed substantial increases in price led by Nickel (up 18.7% and Brass rods, up 14.3%. Only Zinc bucked the trend, down in price 3.9% versus Q3. Year over year, the prices trends were mixed with Nickel up 53.2%, Brass Rod up 4.8%, while Copper decreased 5.5% and Brass Tubes down 1.9% and Zinc Alloy prices were flat versus one year ago.
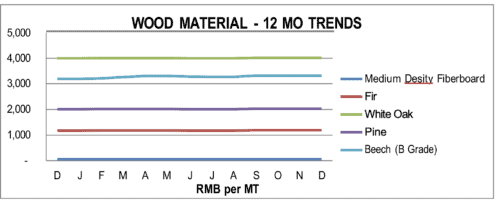
WOOD, PAPER & TEXTILES
Wood prices were flat in Q4 showing little change from Q3. Year over year, with MDF grades up 2% to 5%, Beech up 3.8, Fir up 1.3%, Pine up 1.0%, and White Oak up fractionally versus one year ago.
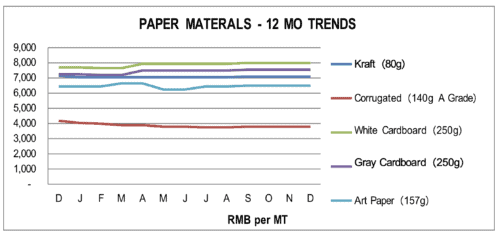
Most all Paper prices were flat in Q4. Year over year, the trend was more mixed with Kraft down 0.7%, Corrugated down 9.5%, while White Cardboard was up 3.9%, Gray Cardboard was up 4.3% and Art Paper was up 0.8% versus one year ago.
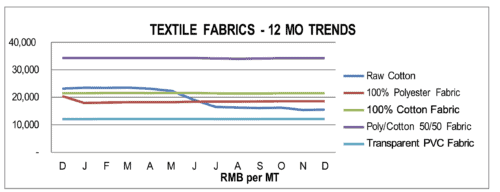
Most Textile fabric prices were up slightly in Q4 by about 1% versus last quarter. Only Raw cotton was down in price 3.7%. Year over year, the price trends were mixed with declines led by Raw Cotton down 32.9% and 100% Polyester Fabric down 9.1%, while Non-woven PP up the most at 6.2% followed by T/C fabric up 2.4%, and PVC fabric up on average by 1% versus one year ago.
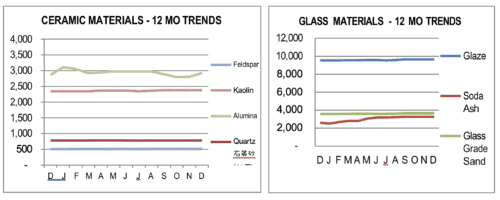
CERAMIC AND GLASS RAW MATERIALS
Ceramic and Glass Raw Materials showed little change over Q3. Year over year, most of the materials were up in price led by Soda Ash up 26.2%, Alumina up 2.3%, Glass Grade Sand and Feldspar up 2%, Kaolin up 1.3% and Quartz was flat versus one year ago.
FUEL
Fuel prices in China moved lower in the 4th quarter led by Diesel declining the most at 10.1%. Year over year, the trend was higher prices for most fuels. up in prices on average 3.9% versus one year ago.
OCEAN FREIGHT
The World Container Index was down 55.7% versus last quarter. Year over year, the World Container Index was down 77% versus one year ago.
COST OF LABOR
Most of the Asian labor rates were unchanged in Dec. Year over year, Labor costs in China were up 4.5%, Vietnam up 5.9%, and Thailand by 5.4%, while Bangladesh labor costs declined 1.2% versus one year ago levels.
CURRENCY EXCHANGE RATE
For the fourth quarter, the USD strengthened against the CNY by 1.9%, however, the Yuan strengthened in December signaling a possible reversal in that trend. Year over year, the USD remained substantially stronger than most of the Asia currencies versus one year ago.
CHINA TRADE (Data lags by one month)
China Imports were up slightly by almost 1% and China Exports increased 3.4% versus December. Year over year, China Imports decreased 7.3% and Exports decreased 10.1% versus one year ago.
The China Consumer Price Index (CPI) was up only slightly 0.2% and the China Producer Price Index (PPI) increased 0.6% in December. Year over year, the China CPI was up 0.3% and China PPI was down almost 10% versus one year ago.
PURCHASING MANAGERS INDEX (PMI)
The China PMI ended Q4 at 47.0, well below the benchmark 50 for an expanding economy and the Hong Kong PMI ended at 49.0, a little bit closer to the 50 mark. The US PMI also remained below 50, with the Manufacturing PMI at 46.2 in December, down from November’s 47.7, while the services PMI activity index fell to 44.4 in December (November: 46.2). Across the private sector, new orders fell at the sharpest pace since May 2020, while new export orders continued to fall, but at a slightly softer pace than in November. Both input and output price inflation eased in December, while employment growth was marginal and business sentiment was pessimistic by historical standards.
CONTACT US FOR MORE INFORMATION
Thank you for taking the time to follow trends in Asia manufacturing. Source International has operational offices in Louisville, Kentucky; Xiamen, China; and Ho Chi Mihm, Vietnam. Our passion is to partner with companies in supply management from Asia. We have a 30+ year on-the-ground track record, a rigorous operating procedure, and a very well-trained local staff. We welcome the opportunity to show you how we can add value to your supply chain in Asia and invite you to visit our offices and website to learn more about us.
For additional details, please refer to the charts that follow or contact one of our Operations Specialists for more information. Thank you for your support.
You may download the entire report here.
Please visit our website at: www.sourceint.com
Data for this report comes from the sources listed and while every attempt is made to be as comprehensive and accurate as possible, please consider that these are just general trends, and you should not draw any specific conclusions from the data. We recommend that any information provided in this report be weighed against other sources and experts on the individual topics covered and\, accordingly, we make no specific claims nor assume any liability from the use of the data contained herein.