Manufacturing Costs Moved Slightly Lower in Q2, 2022
Comments Off on Manufacturing Costs Moved Slightly Lower in Q2, 2022ASIA MANUFACTURING COST DRIVERS REPORT
Q2– 2022 (April, May, June)
Tracking The Trends Which Drive Costs in Asian Manufacturing
Executive Summary
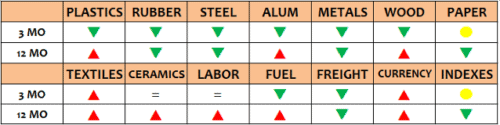
On average, manufacturing costs moved slightly lower in Q2. Most grades of plastics, rubber, steel, aluminum, metals, wood, fuel, and shipping costs, all were lower in price while only textiles showed an increase and paper was unchanged. Meanwhile, the US dollar strengthened against most major Asian currencies. In China, both imports and exports grew in the quarter while the CPI and PPI were both up and the PMI indexes edged up as well.
While China remains closed to foreign visitors, Vietnam and Thailand have now re-opened their borders to foreign visitors and business people. Overall, manufacturing demand in Asia countries improved in Q2, however, signs are pointing to softer demand as we enter Q3. The continued uncertainty of the COVID pandemic, the possibility of a recession, rising interest rates, and unstable geopolitical events remain the biggest variables having an influence on Asia manufacturing costs. We will be monitoring these in the coming weeks and months as things develop.
Below is a chart of the general trends and for all the details, please see the entire report for all the details:
REPORT DETAILS – Manufacturing Costs Moved Slightly Lower in Q2, 2022
PLASTICS & RUBBER
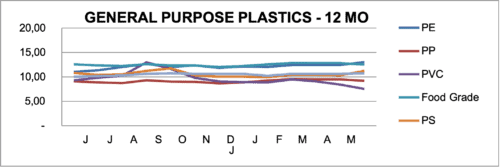
Prices for general purpose plastic resins were mixed in Q2. PVC prices were down the most at around 15%, followed by HIPS and PP both down around 3%. EVA was up sharply but almost 16%, followed by PS up almost 8%, PE up 5% and PET up 4%. Year over year, the trends are also mixed with EVA up 44%, PE up 18%, HDPE up 7%, followed by PS, PET, and PP up slightly. PVC and HIPS are both down in price 19% and 10% respectively.
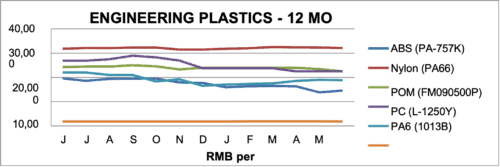
Most grades of engineering plastic prices were down in the quarter led by ABS, POM, and PC down 12.%, 7%, and 6% respectively. On the flip side, Nylon was up 7% and Triton was up slightly. Year over year, the major movers were ABS down 26%, PC down 16%, and Nylon down 15%, while most other engineering grade plastic resins were up slightly or unchanged.
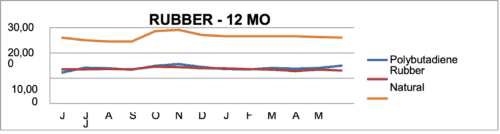
Rubber prices in Q2 showed a slight downward trend with Silicon down the most at 33.3%. The other major movers were Natural Rubber down 3% and EPDM down 2% while Nitrile and Neoprene Rubbers rose 11% and 8% respectively. Year over year, the trends are similar with Neoprene Rubber up almost 58% in price, Nitrile up 18% and Polybutadiene Rubber up 23% while Silicon Rubber was down in price almost 36%, Latex Rubber down almost 8%, Natural Rubber down 4% and EPDM Rubber was flat.
METALS
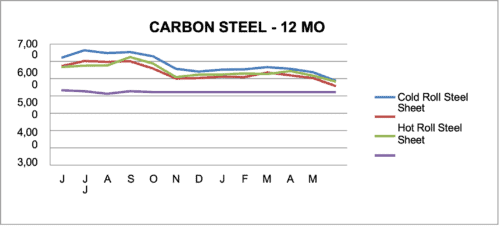
For the second quarter of 2022, the prices for most grades of Carbon Steel were down sharply on average 8% versus Q1. Cold and Cold Rolled Steel were both down around 10% while raw Pig Iron prices were flat. Year over year, most of carbon steels in prices were down on average 10 – 15% versus one year ago.
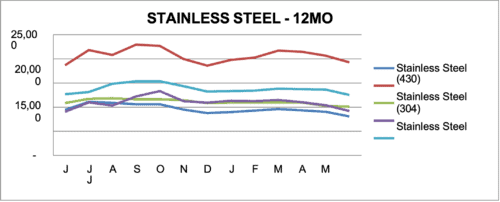
In the Stainless Steel grades, the trend was similar with prices down on average by 12% versus Q1. Year over year, the trend is mixed with 430 down 14%, 304 up 3%, 410 down 7%, 201 up 2%, and 420 down 1% versus one year ago.
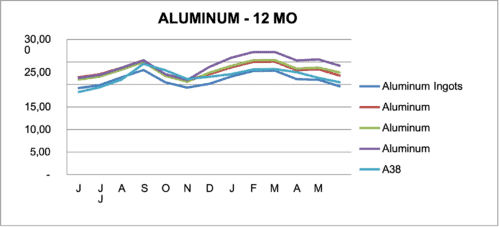
Aluminum prices were down in the second quarter on the average of 13% versus Q1. Year over year, however, most aluminum prices increased on average about 7% versus one year ago led by 6061 up 13% A380 up 12%, and 3003 up 7%.
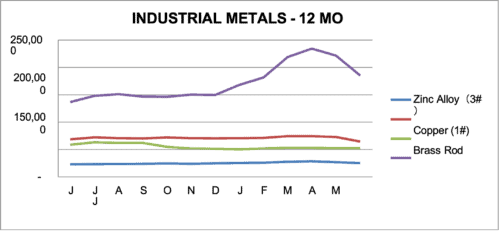
In other Industrial Metals, the trend was down in Q2 on average by about 10%, led by Nickel down 15%, Brass, down 14%, copper down 13%, and Zinc down 8% versus Q1. Year over year, the average price was up by almost 6% versus one year ago, led by Nickel up 35% and Zinc up11%. Decliners included Brass and Copper both down around 5%.
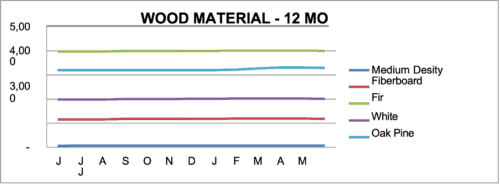
WOOD, PAPER & TEXTILES
Wood prices were down slightly in Q2, about 1%. Year over year prices are up versus one year ago, with MDF board up 7%, Fir up 3%, White Oak up 1%, Pine up 2% and Beech up 3%.
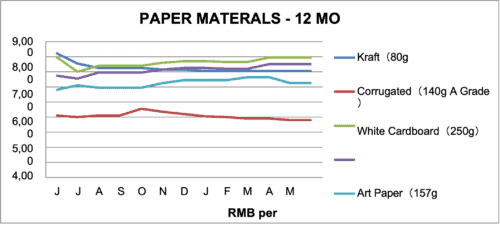
Paper prices were mostly flat in the second quarter. Year over year, most paper prices are down versus one year ago with Kraft down 15%, Corrugated down 7%, and White Cardboard down 1%, while Gray Cardboard and Art Paper are both up in price 11% and 8% respectively, versus one year ago.
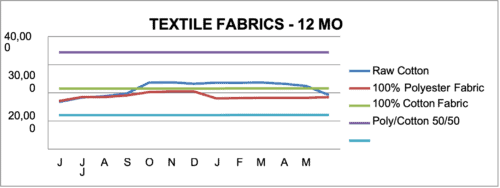
Most Textile fabric prices were up slightly up in Q1 versus than last quarter except Raw cotton which dropped almost 20 in price in the quarter. Year over year, the price trend is up led by Raw Cotton up 15%, Polyester Fabric up about 8%, and PVC Fabric up about 5%, while most other textile fabrics show little change in price versus one year ago.
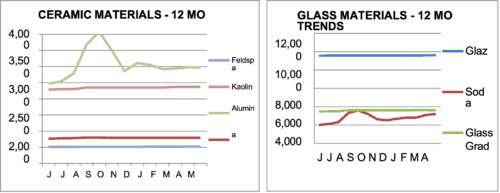
CERAMIC AND GLASS RAW MATERIALS
Ceramic and Glass Raw Materials saw little change in price in Q2 except Soda Ash which was up by about 14%. Year over year, most of material prices were stable except Soda Ash which was up 60% and Glass Grade Sand up a little over 4% versus one year ago.
FUEL
Fuel prices in China were down in Q2 versus Q1, with Petroleum down 18%, Natural Gas down 17% and LGP Gas down 16%. Year over year, the trend for fuel was up significantly versus one year ago, led by LPG up 33%, followed by Diesel, Petroleum, and Natural Gas up around 25% each
OCEAN FREIGHT
The World Container Index dropped about 15% in Q2 versus last quarter. Year over year, container freight prices are down 15-20% versus 2021.
COST OF LABOR
Most of the Asian labor rates were unchanged in Q2. Year over year, Labor costs in China, Indonesia, and Vietnam were all up around 5%
CURRENCY EXCHANGE RATE
For the second quarter, the USD strengthened against most of the Asia currencies, on average by 5%. The US Dollar finished the quarter versus the China RMB at 6.65:1. Year over year, the USD was stronger against Thai Baht and Bangladesh Taka by 10%, the India Rupee by 6%, China RMB by 4% and the Vietnam Dong by 2%.
CHINA TRADE (Data lags by one month)
China Imports were up 33% and Exports were up 42% in Q2 versus Q1. Year over year, China Imports increased 5% and Exports increased 17% versus one year ago.
PURCHASING MANAGERS INDEX (PMI)
The China and Hong Kong PMI ended the quarter at 50.2 and 51.7 respectively and entered expansion territory for the first time in 2022, while the US PMI ended at 53 to remain in expansion territory (above 50).
CONTACT US FOR MORE INFORMATION
Thank you for taking the time to follow trends in Asia manufacturing. Source International has operational offices in Louisville,Kentucky, Xiamen, China, and Ho Chi Minh, Vietnam. Our passion is to partner with companies in supply management from Asia. We have a three-decade long on-the-ground track record, a rigorous operating procedure, and a very well-trained local staff. We welcome the opportunity to show you how we can add value to your supply chain in Asia and invite you to visit our offices and website to learn more about us.
For additional details, please refer to the charts that follow or contact one of our Operations Specialists for more information. Thank you for your support.
DOWNLOAD THE REPORT HERE
Visit our website at: www.sourceint.com
Data for this report comes from various reliable sources and while every attempt is made to be as comprehensive and accurate as possible, please consider that these are just general trends and you should not draw any specific conclusions from the data. We recommend that any information provided in this report be weighed against other sources and experts on the individual topics covered and, accordingly, we make no specific claims nor assume any liability from the use of the data contained herein.