Posted by Joe Simon on | Comments Off on Asia Manufacturing Showed Signs of Improvement in Q4-2022
ASIA MANUFACTURING COST DRIVERS REPORT
Q4–2022(Oct.Nov.Dec.)
Tracking The Trends Which Drive Costs in Asia Manufacturing
Executive Summary
Despite supply headwinds, labor shortages, and an uncertain economic environment, Asia manufacturing continues to surpass the expectations of recent years. Manufacturing has demonstrated continued strength in 2022, building on the momentum it gained emerging from the pandemic, and surpassing expectations from the prior two years. While overall demand and production capacity have hit recent highs, there are indications that the near-term outlook may not be as bright. Asia industry is currently experiencing concerns related to inflation and economic uncertainty. In addition, manufacturers continue to grapple with talent challenges that may limit their growth momentum. Moreover, supply chain issues including sourcing bottlenecks, global logistics backlogs, cost pressures, and cyberattacks will likely remain critical challenges in 2023. As leaders look beyond leading amid disruption and revamp their approach, our 2023 manufacturing industry outlook examines five important trends to consider for manufacturing playbooks in the year ahead.
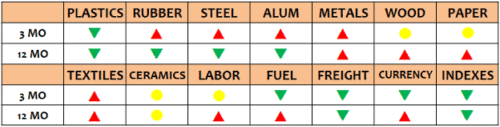
The commodity price trends in the fourth quarter were mixed with plastics, fuel, freight and currency leading the down-in-price group, while rubber, steel, aluminum, other metals, and textiles led the up-in-price group. Meanwhile paper, ceramic materials, and labor costs showed little change. Year over year, plastics, rubber, steel, aluminum, and freight ended the year lower in price than one year ago while metal, wood, paper, textiles, labor, and fuel all saw price increases in the period.
Below is a chart of the overall trends. For all the details, please see the entire report below or download it from the link at the end.
Report Details
PLASTICS & RUBBER
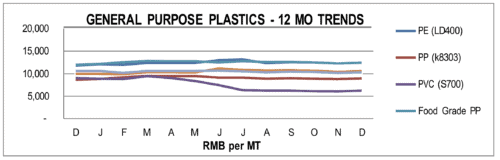
Overall, the General-Purpose plastic resin prices declined in Q4 of 2022 vs Q3 but only slightly. And, in the most recent month of December the trend appears to have reserved with some price increases. Year over year, the results are mixed with PVC, HIPS, HDPE, and PET all showing price declines from 3% to 30%, while EVA, PS, PE and PE all showing increase of 4% to 11% versus one year ago.
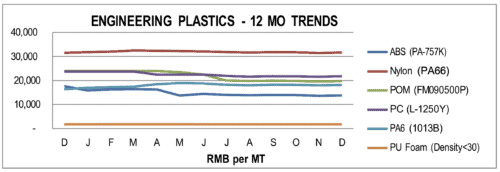
Engineering grade resins displayed a similar trend in Q4 to the General-Purpose grades, with all grades except PU Foam showing price declines, however, they declined less than GP, most less than 1%. Year over year, prices were down on average by 4.5%, led by ABS down 21.8% and POM down17.5% while Nylon increased by 10.3% and Triton and Nylon prices increased slightly, by only about 1% versus 1 year ago.
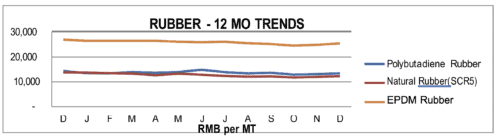
Rubber prices were more mixed in Q4 with the trend generally up on average by about 1.9%. Reclaimed Rubber led the way up 2.6% while Polybutadiene Rubber led the decliners down 2.2%. Year over year, the trends were more mixed, with Neoprene and Nitrile up the most, 27.4% and 18.4% respectively, while Silicon, Natural Rubber, and Latex all showed substantial price declines of 35.7%, 11.5%, and 10.2% respectively versus one year ago.
METALS
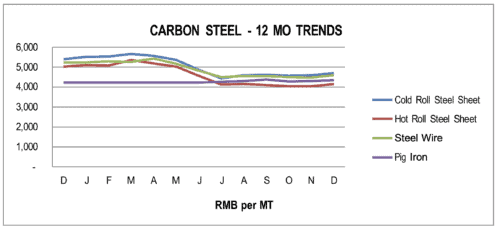
For the fourth quarter of 2022, the prices for most of Carbon Steel grades were up slightly on average about 1% or less versus three months ago with Cold Roll Steel Sheet up the most at 1.7%. Year over year, virtually all carbon steel prices were down on the average 8.6% versus one year ago.
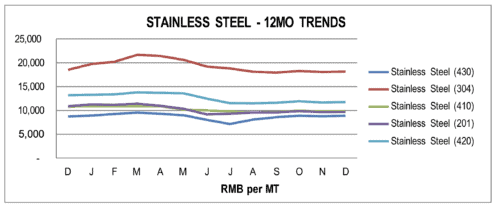
Stainless Steel prices were also up slightly in Q4, on average by 1%-2% compared with last quarter. Year over year, prices were mostly lower than 2021 with 430 and 201 grades down the most on average about 10% versus one year ago
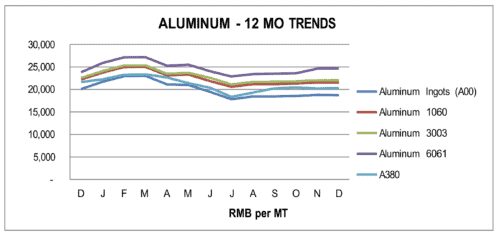
Aluminum prices were higher in Q4, on average by 1%-2%, except 6061 which was up over 5%. Year over year, aluminum prices decreased on the average by 3.2%, however, 6061grade was up 3.6% versus one year ago.
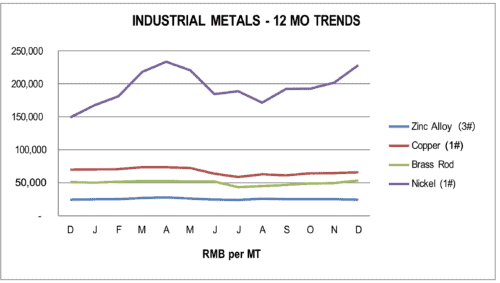
In other Industrial Metals, all showed substantial increases in price led by Nickel (up 18.7% and Brass rods, up 14.3%. Only Zinc bucked the trend, down in price 3.9% versus Q3. Year over year, the prices trends were mixed with Nickel up 53.2%, Brass Rod up 4.8%, while Copper decreased 5.5% and Brass Tubes down 1.9% and Zinc Alloy prices were flat versus one year ago.
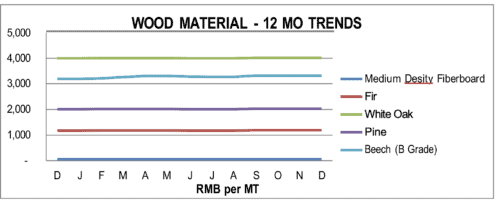
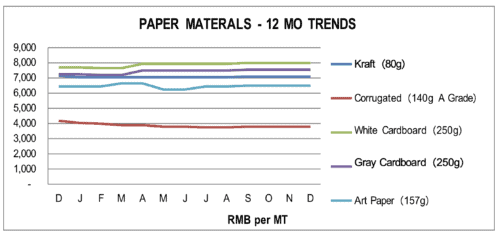
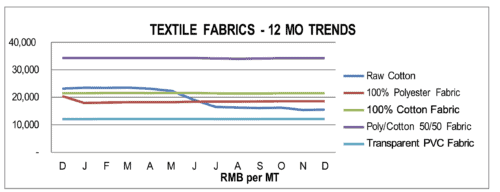
WOOD, PAPER & TEXTILES
Wood prices were flat in Q4 showing little change from Q3. Year over year, with MDF grades up 2% to 5%, Beech up 3.8, Fir up 1.3%, Pine up 1.0%, and White Oak up fractionally versus one year ago.
Most all Paper prices were flat in Q4. Year over year, the trend was more mixed with Kraft down 0.7%, Corrugated down 9.5%, while White Cardboard was up 3.9%, Gray Cardboard was up 4.3% and Art Paper was up 0.8% versus one year ago.
Most Textile fabric prices were up slightly in Q4 by about 1% versus last quarter. Only Raw cotton was down in price 3.7%. Year over year, the price trends were mixed with declines led by Raw Cotton down 32.9% and 100% Polyester Fabric down 9.1%, while Non-woven PP up the most at 6.2% followed by T/C fabric up 2.4%, and PVC fabric up on average by 1% versus one year ago.
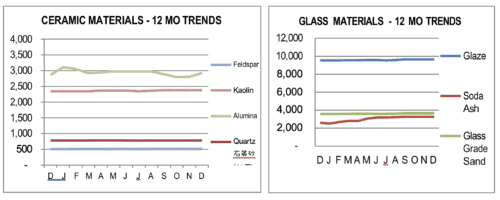
CERAMIC AND GLASS RAW MATERIALS
Ceramic and Glass Raw Materials showed little change over Q3. Year over year, most of the materials were up in price led by Soda Ash up 26.2%, Alumina up 2.3%, Glass Grade Sand and Feldspar up 2%, Kaolin up 1.3% and Quartz was flat versus one year ago.
FUEL
Fuel prices in China moved lower in the 4th quarter led by Diesel declining the most at 10.1%. Year over year, the trend was higher prices for most fuels. up in prices on average 3.9% versus one year ago.
OCEAN FREIGHT
The World Container Index was down 55.7% versus last quarter. Year over year, the World Container Index was down 77% versus one year ago.
COST OF LABOR
Most of the Asian labor rates were unchanged in Dec. Year over year, Labor costs in China were up 4.5%, Vietnam up 5.9%, and Thailand by 5.4%, while Bangladesh labor costs declined 1.2% versus one year ago levels.
CURRENCY EXCHANGE RATE
For the fourth quarter, the USD strengthened against the CNY by 1.9%, however, the Yuan strengthened in December signaling a possible reversal in that trend. Year over year, the USD remained substantially stronger than most of the Asia currencies versus one year ago.
CHINA TRADE (Data lags by one month)
China Imports were up slightly by almost 1% and China Exports increased 3.4% versus December. Year over year, China Imports decreased 7.3% and Exports decreased 10.1% versus one year ago.
The China Consumer Price Index (CPI) was up only slightly 0.2% and the China Producer Price Index (PPI) increased 0.6% in December. Year over year, the China CPI was up 0.3% and China PPI was down almost 10% versus one year ago.
PURCHASING MANAGERS INDEX (PMI)
The China PMI ended Q4 at 47.0, well below the benchmark 50 for an expanding economy and the Hong Kong PMI ended at 49.0, a little bit closer to the 50 mark. The US PMI also remained below 50, with the Manufacturing PMI at 46.2 in December, down from November’s 47.7, while the services PMI activity index fell to 44.4 in December (November: 46.2). Across the private sector, new orders fell at the sharpest pace since May 2020, while new export orders continued to fall, but at a slightly softer pace than in November. Both input and output price inflation eased in December, while employment growth was marginal and business sentiment was pessimistic by historical standards.
CONTACT US FOR MORE INFORMATION
Thank you for taking the time to follow trends in Asia manufacturing. Source International has operational offices in Louisville, Kentucky; Xiamen, China; and Ho Chi Mihm, Vietnam. Our passion is to partner with companies in supply management from Asia. We have a 30+ year on-the-ground track record, a rigorous operating procedure, and a very well-trained local staff. We welcome the opportunity to show you how we can add value to your supply chain in Asia and invite you to visit our offices and website to learn more about us.
For additional details, please refer to the charts that follow or contact one of our Operations Specialists for more information. Thank you for your support.
Dataforthisreportcomesfromthesourceslistedandwhileeveryattemptismadetobeascomprehensiveand accurate as possible, please consider that these are just general trends, and you should not draw any specific conclusions from thedata. Werecommend that any informationprovided inthis report beweighed against other sources and experts on the individual topics covered and\, accordingly, we make no specific claims nor assume any liability from the use of the data contained herein.
Posted by Joe Simon on | Comments Off on Plastic Injection Molding: The Manufacturing & Design Guide
Plastic injection molding is a highly repeatable manufacturing process used to mass-produce identical plastic parts. It is ultimately a cost-efficient method of producing the plastics we use daily, such as bottle caps, toys, and appliance parts.
To begin the process, thermoplastic polymer granules are melted. These polymers, which can be colored or filled with other additives, are then injected under pressure into the mold. The liquid plastic cools and solidifies. Once solid, the mold opens and pushes the part out. Next, the mold closes, and the process is repeated.
This process produces consistent results within tight tolerances and offers manufacturers high levels of design freedom. Though there is a high initial investment in mold creation, the cost is recuperated in high-volume production runs.
Types of Injection Molding
Injection molding can be used to produce tiny parts like model airplane pieces or larger items such as car body panels. The process is primarily used when there is a need to produce thousands, or millions, of identical parts.
Common types of injection molding include:
Blow Molding: Used in forming bottles and other plastic shapes, blow molding is accomplished by blowing compressed air into the mold.
Over Molding: Also known as co-molding or two times injection molding, over-molding involves forming a mold out of one material and then partially or fully covering that mold in another material.
Insert Molding: In insert molding, a non-plastic component is inserted into the mold where it is covered in plastic.
Cube Molding: A molding process for the manufacture of circular parts, cube molding is characterized by components that rotate vertically around the axis.
Materials Used in Injection Molding
A wide variety of materials are used in plastic injection molding. Materials are selected based on their weight, strength, and resistance to certain environments (heat, acid, or moisture). Plastics can also be combined to create different properties and effects.
To achieve optimal end results, there are several factors to consider when planning your injection molding design. Considering the following factors can reduce the risk of defective or substandard final components:
Materials: Each plastic material has different characteristics (elemental resistance, strength, cost) that must be considered. Resins also react differently when treated to heat during the molding process, and they have different features when cooled.
Tolerances: Plastics can warp and shrink in the mold, so this needs to be factored into the design. The chemistry of each plastic also lends itself to different tolerances. For example, acrylics have low shrink rates and can hold tighter tolerances, but LDPE cannot withstand very high temperatures and easily warps.
Mold Design: The mold itself needs to be carefully designed. Wall thickness should be uniform; elements like ribbing can help. Molds also require a certain amount of draft, so the part can be properly ejected. This is especially important in injection molding, as the high pressure allows one to inject plastic into all the small nooks and crannies of a mold, which can make the part hard to remove. Parts with intricate details will also need extra draft to keep the design intact.
Shrinkage Rate: Different plastics shrink at different rates, due to differences in resin structure, the mold itself, and how the plastic flows into the mold. Injection pressure can improve the shrinkage rate, but different resins require different tonnages per square inch.
Surface Finishing: There are 12 grades of plastic finishes according to the Society of Plastics, ranging from dull to shiny. Different finishing services are required for each type of shine – sandblasting produces a dull finish, and diamond polishing creates a mirror shine. One must also consider the plastic itself. For example, you cannot use powder coating on low-melt materials, but plastics like PVC can withstand high temperatures.
Benefits of Plastic Injection Molding
The main benefit of plastic injection molding is that it allows for the rapid manufacture of a large number of identical parts. After covering the initial mold-making cost, the production costs for injection-molded parts are low and continue to decrease as production runs increase.
A wide range of materials can be used in injection molding, and the process is highly repeatable. It produces finished parts with tolerances of ±0.500 down to ±0.125 that have excellent visual appearance and need little or no extra finishing.
Plastic injection molding produces minimal waste compared to other types of traditional manufacturing processes as no material is removed from the cured product.
Source International
The process-driven professionals at Source International can produce plastic molded injection products in a variety of shapes and sizes to suit many different industries. Our ISO 9001-certified facilities give us the capability to deliver a diverse set of parts using a variety of materials.
Providing plastic injection molded products for over 25 years, Source International offers reliable, accurate, and cost-effective plastic injection molding services. With cutting-edge capabilities, we can handle complex molds with core pins, multiple cavities, cams, and lifts for insert molding, over-molding, in-mold decoration, and in-mold assembly. Presses in the 50-ton to 3,300-ton range enable our professionals to create shot sizes as small as 5g to as large as 2,500g with tolerances of ±0.005.
Asia Manufacturing Costs Rose in the First Quarter of 2022
Tracking The Trends Which Drive Costs in Asia Manufacturing As
Q1– 2022 (Jan, Feb, Mar)
EXECUTIVE SUMMARY
Manufacturing costs trended sharply upward in the first quarter of 2022. Most grades of Plastics, Steel, Alum, Metals, Wood, Textiles, Ceramics increased along with costs for Fuel, and Currency. Only Rubber and Paper decreased in the quarter along with Freight costs which declined 4.8% from elevated levels in most of 2021. The cost of Labor was flat in most Asian countries but rose sharply in China by 4.4%. The major manufacturing Indexes indicated slowed growth and contracting economies with the China PMI index down slightly by 1.6%, while the US PMI was down 2.7% in Q1 vs Q4 of 2021. In China, the largest sector of Asia manufacturing, by far, Imports decreased 6.9% and Exports showed a 18.9% decline versus Q4 2021 levels, while the PPI was down by 1.8% and the CPI showed little change.
Continued COVD shutdowns and the war between Ukraine and Russia are expected to put continued pressures on supply and demand for the balance of 2022.
For all the details please see the entire report that follows:
Q4 EXECUTIVE SUMMARY
After a promising first half of the year, the second half of 2021 proved lackluster for Asia manufacturing. Costs in Q4, 2021 moderated on lower demand and work interruptions caused by COVID outbreaks. These factors coupled with shortages of key semiconductor chips and power restrictions in China led to a decline in production capacity utilization.
The commodity price trends in the fourth quarter showed downward movements in some key materials reversing increases seen in the past few quarters. Most grades of steel, aluminum, plastics, other metals, ceramic raw materials, and fuel all showed price decreases while only rubber, paper, textiles, and other metals all increased slightly. Textiles, and labor costs meanwhile were mostly flat in price. Shippers breathed a sigh of relief in Q4 as the World Container Index declined by 10.4% in Q4 reversing the nearly year-long trend of increasing freight rates. China exports remained strong showing 11.4% increase versus Q3 and economic data showed the world’s second largest economy grew faster than expected between October and December. Numbers from China’s National Bureau of Statistics showed the Chinese economy grew by 8.1% in 2021, slightly below the market’s expectation for around 8.4% growth for the year. China’s producer prices dropped 2.3% from November to December 2021.
Numbers from China’s National Bureau of Statistics showed the Chinese economy grew by 8.1% in 2021, slightly below the market’s expectation for around 8.4% growth for the year. In the fourth quarter, China’s GDP rose 4% from a year ago, topping a Reuters poll that predicted a 3.6% increase. Industrial production also rose and beat expectations, but retail sales had a more muted growth.
The outlook for Asia manufacturing production in the first half of 2022 looks promising with strong demand continuing but with some uncertainty over the direction of new Covid outbreaks, power availability, increased fuel costs, and overall inflationary pressures.
For all the details please see the entire report that follows:
Posted by Joe Simon on | Comments Off on Omicron Covid variant poses very high global risk says WHO
Omicron Covid variant poses very high global risk says WHO
Protect yourself from the Omicron Covid variant with KN95 masks. With about one quarter of the American population still unvaccinated and the Omicron Covid variant threatening, all Americans, whether they are vaccinated or not, should wear masks indoors in public spaces and in places where the coronavirus is still spreading. New cases of the COVID delta variant are still rising in many states, especially those with low vaccination rates. Wearing a KN95 mask regardless of vaccination status can protect everyone.
The World Health Organization (WHO) says that the Omicron Covid variant poses very high global risk and is currently advising all people, vaccinated or not, to continue wearing masks when around others as long as there is community spread. The facts are in and masks protect against COVID.
The CDC is now advising all students and staff to wear masks during in-person learning, regardless of their vaccination status. The guidance could serve to reassure educators nervous about coming back into the classroom and give comfort to working mothers looking to re-enter the workplace. Meanwhile, the debate over face masks rages on, divided largely along partisan lines, and has spurred more discussion about mandatory vaccinations in government, higher education, and workplaces.
Which Masks Protect Against COVID best?
Experts say that masking up again is essential and the quality of the mask does matter. A KN95 or N95 mask is going to give a lot more protection since both masks are designed to filter 95% of particles. We know that masks are effective against every variant that this virus has produced when they are tight fitting and used properly to cover the nose and mouth. Some health care experts are now questioning the effectiveness of cloth masks which are reusable after laundering and disposable surgical masks which are cheaper and recommend double masking. That could lead to renewed interest in N95 and KN95 masks that fit much tighter. A well-fitted N95 or KN95 mask is extremely effective in stopping the virus, more so than a cloth or disposable surgical masks.
Posted by Joe Simon on | Comments Off on Asia Manufacturing Stalled in Q3, 2021
Asia Manufacturing Stalled in Q3, 2021 Due to Energy Shortages, COVID Outbreaks, Material Supply Constraints, And Transportation Backlogs
Q3 EXECUTIVE SUMMARY –
Asia Manufacturing Stalled in Q3, 2021 Due to Energy Shortages, COVID Outbreaks, Material Supply Constraints, And Transportation Backlogs. Factory output in Asia slowed in the third quarter as manufacturers battled COVID spikes, worker shortages, material supply constraints, and energy shortages. Raw materials continued their upward trends for the most part and transportation backlogs compounded the global supply chain problems.
The commodity price trends in the third quarter all showed upward movements continuing the trend for all of 2021. Most grades of steel, aluminum, other metals, ceramic raw materials, and especially fuel all showed significant increases while only rubber and paper slowed their climb upwards. Wood, textiles, labor costs, and the exchange rate remain stable meanwhile were mostly flat but showing little decline. Freight costs continued their move upward with The World Container Index up 46.02% over Q2 reaching all-time highs.
Chinese imports were up 4% and exports were up over 8% versus Q2. And, while the CPI declined slightly, the PPI has risen over 9% this year hitting a 13-year high. The China PMI index was at 49.6 in September versus 50.1 in August slipping into contraction for the first time since February 2020.
Unfortunately, the outlook for Q4 does not have many promising signs for quick relief and a continuation or worsening of prices is likely as we move into the holiday season. Demand remains strong from both North America and Europe, and it remains to be seen if rising prices will temper that demand into 2022.
For all the details please see the entire report that follows:
Posted by Joe Simon on | Comments Off on Ask The Experts at the ASD Show, August 2021
YOU CAN’T MISS THIS SHOW & OUR ASK THE EXPERTS PANEL
ASK THE EXPERTS AT ASD MARKETPLACE, NOW BACK LIVE!
Las Vegas will be hopping August 22 through 25 at ASD Market Week with 3,500 booths featuring 1,500 vendors and an inspiring, live educational program. It’s your chance to learn, shop, network, and play all in the same week!
With the return of key vendors and the reimagined all-in-one shopping experience, you’ll see ASD Market Week in a whole new way. Get an up-close look at high-margin products that will pop off your shelves and boost your profits – it’s everything you’ve been waiting for. ASD Market Week is the most comprehensive tradeshow for consumer merchandise in the U.S. Retailers and distributors of all sizes will find that the show floor is filled with quality choices at every wholesale price points
SOURCE INTERNATIONAL will be participating in two thought-provoking, educational sessions held right on the show floor. The success of your product offerings, whether private label or open market goods, depends heavily on finding the right source for product development and manufacturing and on the quality of the final product that reaches your customers. Today’s savvy consumers demand high quality products at the most competitive price, and you only get one chance to make a good impression and to generate a positive customer review. Join our sessions below and network before and afterwards to discuss your specific projects and goals.
Ask the Experts Panelwill be held on Monday, August 23 and will include an interactive session with global supply chain management and legal experts sharing their thoughts on sourcing strategies, best practices, intellectual property protection, industry trends and more with considerable time devoted to questions and answers between audience members and panelist experts.
Global Sourcing and Supply Management . This session will happen on Wednesday, August 25 where you’ll learn tips to engage in collaborative strategic sourcing and global supply management best practices that minimize your risk long with discussions on current trends in global supply management including digital supply networks, sustainability/green product design, speed to market, transparency/social accountability, automation/robotics/smart manufacturing, additive manufacturing, logistics challenges, the onshoring/reshoring movement and more. Time is also allotted for a question/answer period.
Reserve a time to meet with Jim before or after the sessions.
LARGEST WHOLESALE MARKET IN USA
ASD Market Week is the most comprehensive B2B trade show for consumer merchandise in the USA bringing the world’s widest variety of retail merchandise together in one efficient shopping experience. Retailers of all sizes will find that the ASD Market Week show floor is filled with quality choices at every wholesale price point where they can find thousands of high-margin products which consistently achieve a 300% mark up. Whether you have an online store, a brick-and-mortar business, or both, ASD is truly the wholesale buying event that can’t be missed for any small to large sized retail, e-commerce, distribution, or importing business. Lets get back to business with higher margins, wider selection – All in One Market.
What’s more, ASD is the only retail merchandise trade show that allows buyers to network with each other, attend educational seminars, and meet with retail industry experts in order to learn how to sell more products online, drive foot traffic in-store, and improve general business operations. At ASD Market Week, you can learn and stay ahead of the curve with our free retail seminars & educational sessions.
TOP FIVE REASONS TO ATTEND
Highest Margin Merchandise
On-Trend New Products
Educational Sessions
One Place at One Time
Exclusive Buyer Perks
t’s Las Vegas, baby! There are lots of great reasons to attend and the top five reasons are listed above. And, did you know that ASD partners with the best hotels, popular shows, and clubs to bring buyers exclusive events to make the most of the buying trips after-hours where there’s plenty of networking opportunities.
Contact Jimto schedule an on-site meeting at ASD where we can give you helpful tips and discuss how our program can add value to your new product development efforts. And, join our Ask the Experts panel and Global Sourcing session to gain valuable knowledge about developing private label products.
Don’t miss the opportunity to learn from retail industry experts at ASD. From how to build an online presence to how to diversify your merchandise mix and attract a wide range of customers, you will not want to miss our FREE educational sessions held on the ASD and IRC Stages. Check out the full seminar schedule.
Be sure to Contact us to set up a private meeting on-site where we can discuss how Source International can add value to your product supply chain.
Posted by Joe Simon on | Comments Off on Masks Protect Against the COVID Delta Variant
COVID Delta Variant Is Spreading Quickly In The United States
With more than ¼ of the American population still unvaccinated and the COVID delta variant causing surging infections in the US, the Centers for Disease Control and Prevention (CDC) reversed their previous guidance this week and is now recommending once more that all Americans, whether they are vaccinated or not, wear masks indoors in public spaces in places where the coronavirus is spreading. The fact show that cases are now rising in most every state with hospitalizations surging in states with low vaccination rates. Over 80% of the new cases are the COVID delta variant. While most of the outbreaks are happening among unvaccinated individuals, wearing a mask regardless of vaccination status can protect everyone.
In May when the CDC suggested that vaccinated people no longer needed to wear masks, indoors or out, the US joined a few other western countries to move away from mask usage before the end of the pandemic. Now, less than three months later, the CDC announced it had again changed its guidance on masks based on data showing that vaccinated people infected with the highly infectious delta variant carry the same viral load as unvaccinated people who are infected. The World Health Organization (WHO) is also currently advising all people, vaccinated or not, to continue wearing masks when around others as long as there is community spread. The facts are in and masks protect against the COVID delta variant.
In addition, the CDC also provided new guidance on face masks in schools and is now advising all students and staff to wear masks during in-person learning, regardless of their vaccination status. The guidance could serve to reassure educators nervous about coming back into the classroom and give comfort to working mothers looking to re-enter the workplace. Meanwhile, the debate over face masks rages on, divided largely along partisan lines, and has spurred more discussion about mandatory vaccinations in government, higher education, and workplaces.
Which Masks Protect Against the COVID Delta Variant?
Experts say that masking up again is essential to combat the highly contagious delta variant. It’s reported to have similar levels of concentrations in the air and permeability as the original COVID strains, but the quality of the mask does matter. A KN95 or N95 mask is going to give a lot more protection since both masks are designed to filter 95% of particles. We know that masks are effective against every variant that this virus has produced when they are tight fitting and used properly to cover the nose and mouth. And, wearing masks can prevent us from shutting down our economy again. Because the delta variant is so contagious, some health care experts are now questioning the effectiveness of cloth masks which are reusable after laundering and disposable surgical masks which are cheaper. That could lead to renewed interest in N95 and KN95 masks that fit much tighter. A well-fitted N95 or KN95 mask is extremely effective in stopping the virus, more so than a cloth or disposable surgical masks.
The CDC warns that about 60% of KN95 masks in the U.S. are counterfeit, and do not meet US standards. VexStar Medical has FDA approved KN95 masks in stock and ready for immediate delivery. Contact us today at 502-589-7900 to protect yourself, your family, and your staff.
What’s the difference between N95 and KN95 Masks?
Simply put, N95 masks are the US standard for respirator masks (United States NIOSH-42CFR84) while KN95 masks are the China standard (China GB2626-2006). The US National Institute for Occupational Safety and Health (NIOSH), a division of the CDC, requires manufacturers to meet the NIOSH standards in order to label their masks as N95s but, despite differences, the two masks are nearly equivalent on many critical features. One advantage of KN95 over N95 mask is that to be certified, the China government requires the manufacturer to run mask fit tests on humans while the N95 mask standard does not require manufacturers to run fit tests. Check out all the details of the differences between N95 and KN95 in this comparison chart.
Posted by Joe Simon on | Comments Off on Asia Manufacturing Costs Higher in Q2 – 2021
Asia Manufacturing Costs Increased in Q2-2021 Driven by Supply Chain Disruptions, Raw Material Increases, and Higher Transportation Costs
Q2 EXECUTIVE SUMMARY – Asia Manufacturing Costs saw sharp rises in raw material costs and strains in supply chains in Q2. Meanwhile, contrained output and the spread of new COVID variants (especially in India) fueled further negative impact on productivity and supply chains. These factors coupled with logistics issues at Asian and US ports and surges in transportation costs are further complicating the situation and driving higher prices.
The commodity price trends in the second quarter all showed significant upward movements continuing the trends of the past few quarters. Most grades of steel, aluminum, other metals, ceramic raw materials, and fuel all showed increases while only plastics and paper retreated slightly from significant increases earlier in the year. Wood, textiles, and labor costs meanwhile were mostly flat in price. The World Container Index increased by 19.6% in Q2 continuing the uptick in logistics costs this year and was by far the highest in recent years. China exports surged 16.7% versus Q1 reflecting the strong demand in the marketplace with heavy order volume. China’s producer prices rose by 8.8% year-on-year in June 2021 after a 9.0% gain in May and was the sixth straight month of increases in factory prices.
The outlook for Asia manufacturing production in the second half of 2021 continues to be strong led by the rapid expansion forecast for world economic growth of around 5% year over year.
For all the details please see the entire report that follows:
Posted by Joe Simon on | Comments Off on US-CHINA TRADE – OVER 235 YEARS AND STILL GROWING
US-CHINA TRADE – OVER 235 YEARS AND STILL GROWING
US-China Trade continues to grow year by year in spite of political, cultural, and geographic differences. In July of each year, both the US and China celebrate the beginnings of their countries as we know them today. On July 4, Americans celebrate Independence Day (1776) while for the Chinese, July 23rd marks the anniversary of the founding of the modern government of China (1921). It’s a big deal for both counties and an important month to stop and see how far we’ve come with US-China trade relations.
The Office of the US Trade Representative Reports that U.S. goods and services trade with China totaled an estimated $634.8 billion in 2019 (latest data available). Exports were $163.0 billion; imports were $471.8 billion. The U.S. goods and services trade deficit with China was $308.8 billion in 2019 with trade in services only with China (exports and imports) totaled an estimated $76.7 billion in 2019. Services exports were $56.5 billion, while services imports were $20.1 billion giving the U.S. a services trade surplus with China was $36.4 billion in 2019. According to the U.S. Department of Commerce, U.S. exports of goods and services to China supported an estimated 911,000 jobs in 2015 (latest data available), with 601,000 jobs supported by goods exports and 309,000 jobs supported by services exports.
Currently, China is the 3rd largest goods export market for the US and it largest import partner. But where did it all start from?
Posted by Joe Simon on | Comments Off on JOIN US for 3 Learning Sessions at the ASD SHOW in Las Vegas – July 28-31
Come join us at the ASD Show in Las Vegas July 28-31 for 3 exclusive learning sessions targeted to all private label buyers and importers. ASD Market Week is 9 Trade Shows in 1 Central Location that features 19 Retail Categories from 2,700 Vendors from around the world. You can Find New Suppliers and Vendors, Thousands Of High-Margin Products which Consistently Achieve a 300% Mark Up and Enjoy Exclusive Deals & Perks Designed For ASD Attendees.
ASD Market Week (previously ASD AMD) is the most comprehensive trade show for consumer merchandise in the U.S. As the leading B2B trade show in Las Vegas, ASD brings the world’s widest variety of retail merchandise together in one efficient shopping experience. Retailers of all sizes will find that the ASD Market Week show floor is filled with quality choices at every wholesale price point.
What’s more, ASD Market Week is also home to the SourceDirect trade show, a B2B show for importers, distributors, wholesalers, and large retailers to buy wholesale goods directly from overseas manufacturers. SourceDirect at ASD is the go-to destination for buyers looking to source new product categories and find new ways to directly profit from manufacturers coming from top sourcing countries.
Whether you have an online store, a brick-and-mortar business, or both, ASD is truly the wholesale buying event that can’t be missed for any small to large sized retail, e-commerce, distribution, or importing business.
Contact Jim to schedule an on-site meeting at ASD where we can give you helpful tips and discuss how our program can add value to your new product development efforts. And by joining our 3 learning sessions you’ll gain valuable knowledge about developing private label products.
Registration to ASD and Source Direct is free through the link below.
This session will cover the fundamentals of sourcing your products overseas. The panel will share their varied expertise covering the process of finding new suppliers, supply chain strategies as well as the art of negotiation and legal issues for newcomers to the industry.
This interactive Q&A allows attendees to ask the panelists questions pertaining to sourcing and importing. Experts will address questions from the audience as well as answer questions that arose in previous seminar discussions leading up to this Q&A. We encourage an interactive dialogue where no sourcing topics are off limits. Walk away from this session with the sourcing knowledge and confidence you need to further your business.
Driving Product Success and Positive Product Reviews Through Effective Sourcing and Quality Assurance
Tuesday, July 30, 2019: 11:30 AM – 12:30 PM
The success of your product offerings, whether you offer private label or open market goods, depends heavily on finding the right source for product development and manufacturing, and on the quality of the final product that reaches your customers. Today’s savvy consumers demand high quality products at the most competitive price and you only get one chance to make a good impression. You may have the latest innovative, on-trend product but if the quality is not on-spec, it doesn’t arrive on time, or the price is not competitive, your chance to generate a positive customer review is greatly reduced or, even worse, may generate a product-killing bad review. In this session you’ll learn tips to engage in collaborative strategic sourcing that minimizes your risk, quality assurance best practices, and how to incorporate green initiatives to reduce your carbon footprint to drive product success for your brand and those all-important positive customer reviews.
Posted by Joe Simon on | Comments Off on Supply Chain Best Practices – 2021 Update
Supply Chain Best Practices for 2021
Supply Chain Best Practices is a topic of great interest to Source International and every progressive supply management organization. We study the market to gain insights into what the best and the brightest are doing. One such resource is Gartner, a leading research and advisory company founded in 1979, that researches the supply chains of hundreds of companies to produce the Gartner Supply Chain Top 25, an annual ranking of the world’s best supply chains. Gartner’s Top 25 celebrates examples of supply chain excellence that understand customer value, invest in demand management, and promote innovation.
The three key trends of supply chain best practices that stand out for 2021 are:
The Purpose-Driven Organization
In large corporate supply chains, more ambitious sustainability goals are being set and the plans to achieve these goals look more achievable than ever. Some are even treating environmental, social and governance (ESG) investments as a purely operational cost. Many investments benefit both planet and business with sustainability factors like carbon emissions considered along with cost and service trade-offs. Some examples include optimizing inbound supply and distribution networks to take vehicles off roads and reducing air freight. Process-based companies are reusing heat from upstream manufacturing processes to power others downstream. At a product development level, we see more recyclable and compostable materials and creative solutions for increasing shipping density. Some products are being designed for circularity, while others are designed to drive a smaller customer environmental footprint. Beyond the natural environment, many supply chain organizations have increased focus on diversity, equity and inclusion (DEI). Some have even linked executive bonus compensation to progress against DEI goals.
Customer-Driven Business Transformation
The COVID pandemic produced supply disruptions, larger-than-normal demand swings, and an accelerated level of business model transformation, requiring supply chains to be highly adaptive. Many changes were driven by an increase in products and services delivered directly to customers and patients, instead of through more traditional, centralized locations such as physical stores and medical facilities. Retailers saw tremendous shifts from brick-and-mortar channels to direct-to-consumer (DTC) sales, which in turn required significant investments in fulfillment center automation to handle elevated e-commerce orders. As DTC orders have increased as a percentage of sales, the higher cost of delivery in the “last mile” has led to innovation and new partnerships such as co-sharing brick-and-mortar space for specialty sales and expanded e-commerce returns offerings. Overall, the supply chains most able to adapt to shifting business conditions win in the marketplace.
The Digital-First Supply Chain
Supply chain leaders have reached a point where they consider themselves “digital first” in the use of technology to enable more seamless customer experiences and more automated and insightful decisions in supply and product management. A common feature is a shift toward common ERP platforms, processes and datasets that can be leveraged for insight and decision making. Artificial intelligence (AI) and machine learning (ML) are being used more commonly to analyze supply constraints in real time and balance market share, profit and customer support objectives such as in transportation to monitor and manage shipments. Shop floor automation continues in factory environments with some of the more advanced players using centralized, remote factory monitoring and accelerated automation in distribution and fulfillment centers. Digital transformation requires talent. Several supply chain organizations run digital literacy and dexterity programs to enable employees to better understand and exploit digital business opportunities and learn how to use data-driven analytics for more informed decision making in their roles.
2021 Supply Chain Excellence Ratings
The 2021 Rankings of the world’s most superior supply chains that lead the workd in deveoping and implementing Supply Chain Best Practices:
Cisco Systems
Colgate-Palmolive
Johnson & Johnson
Schneider Electric
Nestlé
Intel
PepsiCo
Walmart
L’Oréal
Alibaba
AbbVie
Nike
Inditex
Dell Technologies
HP Inc.
Lenovo
Diageo
The Coca-Cola Company
British American Tobacco
BMW
Pfizer
Starbucks
General Mills
Bristol Myers Squibb
3M
Superior supply chains deliver on the business’s purpose and employing supply chain best practices help organizations understand customer value, invest in demand management, and promote innovation against ESG using peer benchmarks for supply chain transformation and to accelerate supply chain performance. Thanks to Gartner for this excellent report on and for some very helpful Supply Chain Best Practices to shore up supply chains in 2021 and beyond. Download their complete report HERE.
For more information on Source International and how we can help your company achieve supply chain excellence contact our experienced team today to set up an exploratory call. You’ll be glad you did!
Posted by Joe Simon on | Comments Off on LOOKING FOR A RELIABLE SUPPLIER OF PPE?
Do you know someone who has been having a hard time finding a reliable supplier of PPE to protect medical professionals?
Lets face it, finding a reliable supplier of PPE is no easy task for large health care organizations and is especially difficult for smaller clinics, doctors, and other medical offices. Shortages of Personal Protective Equipment (PPE) in the USA have reached crisis proportions and everyone is scrambling to buy direct from China’s mature market where up to 85% of the world’s suppliers are located including the basic raw material, nonwoven polypropylene fabric. With health professionals facing shortages and the CDC recommending the voluntary use of face coverings, do you wonder where and how to fill your supply lines reliably?
In today’s market it is “buyer beware” like never before. It seems that whenever there is a strong market driven by fear there are also plenty of scammers and marginal suppliers ready to take your money by telling you exactly what you want to hear. For example, Canadian health officials reported recently that “around 1 million KN95 respirators acquired from China have failed to meet federal Covid-19 standards for use by front-line health professionals.” If you want to protect your organization from a “PPE Nightmare” it is imperative that you find a reliable supplier of PPE and leverage their experience, network, and infrastructure to your advantage.
WHAT TO DO?
Mitigating PPE Quality Risks
You should know that due to the rush of getting as much product out the door as possible in the least amount of time, some PPE manufacturers are not making quality product that consistently meets the specifications that it is rated for. Hospitals and medical facilities in Europe, the United States, and Australia have all recently discovered defective and counterfeit N95 and KN95 face masks from China.
Given the tight market and rising costs of PPE, it is highly recommended to conduct a pre-shipment inspection at the factory before allowing any PPE to ship. While inspections are not a 100% guarantee, the use of a statistical, random sampling and auditing the lot of goods at the factory that produced them is standard protocol and mitigates your risk significantly, raising your confidence that there will not be any issues when the goods arrive. In addition, when manufacturers know that a buyer is going to do a physical pre-shipment inspection, just knowing it can make them act more diligently.
Performing a professional pre-shipment inspection allows a visual check of appearance, quantity, labeling, packaging verifications and on-the-spot tests including flammability, colorfastness, airflow, dampness, mold, and odor to further mitigate your risk. Independent lab tests can provide the maximum level of verification but may take up to a week or longer and cost several thousand dollars. However, independent testing may make sense for large orders depending on the urgency of the goods but when independent lab tests are required it is recommended to have a third-party select random samples from the shipping lot, not rely on the factory to do it themselves.
Five Easy Steps To Avoid Getting Burned on PPE
According to current regulations, which have been tightened recently, the manufacturer that produces the product, the exporter, and the importer all need to be registered with their respective governments. You can qualify a reliable supplier of PPE in China by making sure the factory and importer are registered with the FDA for the specific product that you are buying and that the exporter is registered with the China government to export the specific product that you are buying. If you are using a broker, take an extra step to make sure that they can provide proof of their relationship with the manufacturer. And, in addition to verifying that their registrations are legitimate, make sure that you have proper documentation that the production also meets the international standards that it is supposed to meet. In summary, there are five easy steps to avoid getting burned when you buy PPE in China:
Verify the Manufacturer
Verify the Raw Materials
Verify the Exporter of Record
Inspect the Finished Product Pre- Shipment
Verify the Importer of Record
In short, due diligence is more important than ever when trying to qualify a reliable supplier of PPE.
Source International is a Reliable Supplier of PPE
We invite you to share your experiences in finding a reliable supplier of PPE and what unmet PPE needs you have that we can help you solve. Supplying PPE that protect our medical workers is a job that requires attention to detail and a professional team.
TheSource International PPE Team in the USA, China, and Vietnam serves customers large and small for high quality, on-time PPE at a fair price. As a registered FDA importer, we sell specific FDA registered products such as surgical masks, face shields, disposable isolation gowns, FFP2 respiratory masks, KN95 masks and other PPE products.
Our team of on-the-ground supply chain professionals perform inspections and testing of randomly selected samples from every shipment on-site at our FDA certified manufacturers. Years of experience in supplying OSHA first aid kits and other disposable medical devices and a 3-decade long track record of excellence are your assurances that Source International is a reliable supplier of PPE.
Contact our USA offices to speak with one of our PPE professionals on your time zone (east and west) for the most up-to-date product offerings, cost, and availability.
Posted by Joe Simon on | Comments Off on Betting on China Manufacturing-Tesla’s journey
Tesla is doubling down on China Manfacturing
Opposite of what the market is doing, Elon Musk, true to his contrarian nature, is heading in the opposite direction and doubling down by heavily betting on China manufacturing. His Shanghai Gigafactory 3 went online in record time last year and currently Tesla stock is said to be more valuable than the market capitalizations of all China’s listed carmakers combined. Tesla is the sole owner of its Gigafactory 3 car plant in Shanghai and this is the first time that this has been allowed in China, previously requiring joint ventures with local partners. Combined with low cost land and government incentives including low-interest loans and subsidies, Tesla was able to drop prices and increase sales and manufacturing volumes.
Betting on China manufacturing
In a recent article in Week In China published by HSBC, the authors discuss the Tesla strategy betting on China manufacturing and its approach to sales and manufacturing. Tesla recently selected China’s Contemporary Amperex Technology (CATL) and South Korea’s LG Chem as new battery suppliers in an effort to diversify its sourcing chain beyond Panasonic and allowing it to retain all three of the leading EV battery makers in its supply chain. They discuss a possible “cultural clash” emerging and Musk’s vision for upending 100 years of automotive tradition. And, as the EV companies battle over charging standards, a confrontation is likely to develop. Further, the emergence of cobalt free batteries has the potential to lower the battery costs significantly.
All of this is intertwined with Tesla’s sales strategy in China and its Chinese competitors. BYD, a Chinese battery-maker that morphed into a car firm (backed by Warren Buffett and South Korean giant Samsung), is one of China’s closer competitors to Tesla.Similar to Tesla’s business model, BYD has branched out into solar panels and energy storage and an ambition to accelerate the world’s generation and storage of clean energy. Tesla is seen as a trendy pacesetter in China this year, despite the virus, accounting for nearly 1/3 of all electric vehicle sales in China in 2020 so far.
So, what about your company? Are you betting on China manufacturing? Could your Asia supply chain need a tune-up to compete in the “new world”?
Let our team of professionals show you how we can add value to your supply chain in these volatile times. Now, more than ever, you need someone on your team, looking out for your interests and controlling the hard to control offshore manufacturing situations.
Contact us today to get started on your “buy global – act local” supply chain strategy.
To learn more about Source International, visit our About Source page.
Posted by Joe Simon on | Comments Off on DO YOU WONDER ABOUT THE PATH FORWARD FOR BUSINESS WITH CHINA?
Our customers have been asking for months about the path forward for business with China. While the future is never crystal clear, what seems evident to us is that business in China will continue to be a critical part of every global supply chain manager’s portfolio for years to come. It stands to reason that Supply Managers are concerned, and with good reason, especially with all the news in recent weeks regarding the coronavirus pandemic on top of the trade tariffs imposed by President Trump last year. But, in spite of these setbacks, there is still no better place to manufacture most products than China. In a recent post by Jonathan Bench in the China Law Blog (a great publication that we respect and follow) he outlines his thoughts and reasoning that China is not going away anytime soon. Specifically, he writes: ” When I say there is a good path forward in doing business with China, I am not saying it will be an easy path forward – only that doing business in and with China is a viable path forward and though it will certainly have its ascents and descents (as it always has) that path has an upward trajectory.” We agree with Jonathan 100%!
WHAT IS THE PATH FORWARD FOR BUSINESS WITH CHINA?
Social media is buzzing these days with companies talking about all the reasons that they have for leaving China and moving their manufacturing supply chains back home or to other low cost countries. What with trade tariffs and now this crazy corona-virus, there are a lot of reasons to be concerned. We have seen a slow trend that began several years ago from companies either looking to make a move, testing the waters elsewhere, or going forward with a move.
CHINA STILL HAS THE BEST MATERIALS AND INFRASTRUCTURE
Manufacturers rely on local suppliers for an array of materials, parts, and components, so relocating production requires an expensive and time-consuming effort finding new suppliers that meet quality standards and that have adequate capacity to take on more business on a specified timetable. Qualified suppliers may not always be available when and where you want them. Finding proper materials can also present a challenge since China produces many of the materials used in other Asian counties and has an extensive, developed infrastructure to deliver them efficiently. It will take years and years before the entire ecosystem of manufacturers and suppliers can shift out of China—if it ever does. We are betting that China will recover and come back stronger than ever and remain competitive despite some short term pain.
CHINA STILL HAS THE BEST LABOR FORCE AND TREMENDOUS CAPACITY
Source has been part of the development and training of the workforce as it has matured over the past 25 years. Source professionals are unparalleled anywhere thanks to our rigorous training programs. No country has a workforce that is as dedicated and productive as China. No country serves such a wide range of industry as China. And, no country supports it’s industries like China. And, now, with the “phase one” trade deal with China in place, the Trump administration has agreed to scrap planned tariffs on $160 billion of Chinese goods and to cut the tariff rate on another $120 billion of goods in half to 7.5%. ALL THIS LEADS TO MORE AVAILABLE CAPACITY AND MORE NEGOTIATING STRENGTH.
THERE WILL BE A NEW NORMAL IN CHINA ONCE THE VIRUS FEARS SUBSIDE
We definitely see a “New Normal” emerging from a tough 2019 and a slow start to 2020. Many things will have to change to protect the workers and the public at large. A greener, more organized country is likely to emerge in a new push for health and public welfare. China is used to change and is likely to find novel ways to adapt and continue to prosper.
We caution companies to consider all of the factors before leaving China and shifting manufacturing to other low-cost countries in Southeast and South Asia, Africa, Eastern Europe, or Latin America. As for Source International, we are NOT leaving China but, instead, see this as a great opportunity to serve our customers in new and different ways. We plan to double down our efforts to provide new answers to the new, pressing manufacturing and quality assurance questions that have emerged.
LEAVING CHINA IS NOT THE BEST OPTION IN SPITE OF THE CHALLENGES
Posted by Joe Simon on | Comments Off on ASD SHOW SOURCING PANEL, March 2020
YOU CAN’T MISS THIS SHOW & THIS SOURCING PANEL.
ASD and Source Direct are right around the corner where we will be participating in a thought-provoking Sourcing Panel held right on the show floor with the audience participating. Las Vegas will be hopping March 22 through 25 at ASD Market Week with 9 Trade Shows in 1 Central Location including 2,700 Suppliers and over 45,000 Buyers from around the world. It’s your chance to learn, shop, network, and play all in the same week!
ASD Market Week is the most comprehensive B2B trade show for consumer merchandise in the U.S. ASD brings the world’s widest variety of retail merchandise together in one efficient shopping experience. Retailers of all sizes will find that the ASD Market Week show floor is filled with quality choices at every wholesale price point where they can find thousands of high-margin products which consistently achieve a 300% mark up.
What’s more, ASD Market Week is also home to the SourceDirecttrade show for importers, distributors, wholesalers, and large retailers to buy wholesale goods directly from overseas manufacturers. SourceDirect at ASD is the go-to destination for buyers looking to source new product categories and find new ways to directly profit from manufacturers coming from top sourcing countries.
Every business owner has the same goal; to make money. ASD is the largest wholesale merchandise trade show in the USA. Whether you have an online store, a brick-and-mortar business, warehouses or all of these, ASD is truly the wholesale buying event that can’t be missed for any retail, e-commerce, distribution, or importing business.
What’s more, ASD is the only retail merchandise trade show that allows buyers to network with each other, attend over 100 educational seminars, and meet with retail industry experts in order to learn how to sell more products online, drive foot traffic in-store, and improve general business operations. At ASD Market Week, you can learn and stay ahead of the curve with over 100+ free retail seminars & educational sessions.
TOP FIVE REASONS TO ATTEND
Highest Margin Merchandise
On-Trend New Products
100+ Educational Sessions
One Place at One Time
Exclusive Buyer Perks
It’s Las Vegas, baby! There are lots of great reasons to attend but and the top five reasons are listed above. And, did you know that ASD partners with the best hotels, popular shows, and clubs to bring buyers exclusive deals to make the most of the buying trips after-hours. From Cirque Du Soleil to buyer happy hours, there’s plenty of networking opportunities. See what events are happening on our Facebook events.
Contact Jimto schedule an on-site meeting at ASD where we can give you helpful tips and discuss how our program can add value to your new product development efforts. And, join our Sourcing Panels to gain valuable knowledge about developing private label products.
Registration to ASD and Source Direct is free through the link below.
As the trade war looms on between the U.S. and China, Kentucky businesses are modifying business practices to navigate this new environment. What does the future hold for the relationship with China and our Kentucky businesses? How can Kentucky continue to leverage this important trading partner for future business growth? We will hear from a group of distinguished speakers who will help global companies address the issues surrounding the ongoing trade wars, and provide insight into future business practices in China which will mitigate risk and reap rewards.
The keynote speaker will be Vivian Liu, Senior Vice President and Chief Financial Officer, Lexmark International and our panelists will be Alan Black, Regulatory Affairs Leader, Valvoline; Jeffery Langer, Member, Stites and Harbison and Harbison, and Jim Ullum, Managing Partner, Source International.
The session will explore the topic, the Future of the China Relationship For Kentucky Business, and various aspects related to this important topic including specific issues faced by US companies in China and risk mitigation recommendations.
PROGRAM AGENDA:
7:30 – 8:25 – Breakfast (buffet style)
8:30 – 8:40 – Intro remarks (World Trade Center Kentucky and sponsors)
8:40 – 9:10 – Keynote speech (high level overview of current US-China trade and economic relationship)
9:10 – 9:15 – Introduction to panelists (keynote speaker will join panel)
9:15 – 9:55 – Panel discussion – Discuss specific issues faced by US companies in China and risk mitigation recommendations
9:55 – 10:00 – Closing remarks, update on upcoming World Trade Center Kentucky educational programs
Posted by Joe Simon on | Comments Off on The Supply Chain Conference Of The Year Is Coming In September!
Join us for the all-new ASCM 2019 taking place September 16 – 18. THE SUPPLY CHAIN CONFERENCE OF THE YEAR will feature all new content, insightful speakers and keynotes, and the opportunity to build connections with supply chain professionals from across the world.
ASCM 2019 features keynote by Fareed Zakaria, CNN Worldwide host, Washington Post columnist, and best-selling author. There will also be a lineup of knowledgeable thought-leaders addressing end-to-end supply chain topics. Each individual has been carefully selected to ensure a broad range of content, viewpoints and topics. Presenters include respected business leaders, authors, educators and innovators who share their expertise through more than 60 educational sessions.
This influential conference from the world’s leading supply chain organization brings together more than 2,000 people from 50+ countries. You’ll make invaluable contacts, explore new and different ways of thinking, and meet people from many of the world’s most respected organizations.
No Other Event Covers End-To-End Supply Chain In As Much Depth
From planning and procurement through production, delivery and return, ASCM 2019 is the place for end-to-end supply chain education. Professionals from all areas of the value chain rely on the annual conference for career-building knowledge.
It’s All About Education
ASCM 2019 is first and foremost an educational conference that provides an immersive learning environment that will advance your knowledge, skills and ability to move organizations forward. ASCM 2019 features 65+ sessions that are mapped across six learning paths to cover all aspects of the extended supply chain; plan, source, make, deliver, return, enable.
ASCM 2019 is first and foremost an educational conference that provides an immersive learning environment that will advance your knowledge, skills and ability to move organizations forward. ASCM 2019 features 65+ sessions that are mapped across six learning paths to cover all aspects of the extended supply chain; plan, source, make, deliver, return, enable.
BE SURE TO CATCH THE PRESENTATION BY SOURCE INTERNATIONAL AND LIBBEY ON WEDNESDAY, SEPTEMBER 18, 2019 – 11:00 AM – 12:00 PM PDT
Enabling Network Optimization through Effective 3rd Party Management – Hosted by Mike Bunge (Libbey) and Jim Ullum (Source International)
EXERPT: When seeking new outsourcing opportunities and strategies to manage risk and maximize team performance, using real-world case studies is a highly effective way to learn what has worked and what hasn’t worked for other organizations. Whether you directly manage outsourced suppliers or work through a service provider, outsourcing is a multifaceted process with goals that include lowering costs, managing quality, gaining operational efficiencies, enabling access to external resources, and many others. This joint session includes the perspectives of an outsourcing service provider and a manufacturer who will share sourcing and procurement best practices and strategies. They will outline solutions to address some of the challenges you might encounter in areas including QA, auditing, ethics, product development, cost drivers and cost justifications, and navigating in a low-cost, offshore environment.
This session will count as 1 elective credit hour toward the ASCM Risk Management Education Certificate.